Tag: Aurélien Tabard

2016 – FizViz: A Wall-Mounted Data Gauge

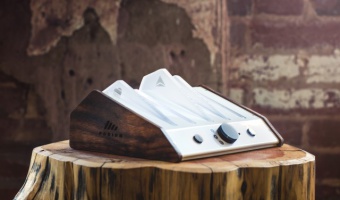
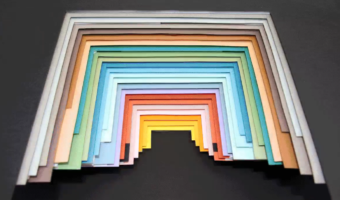
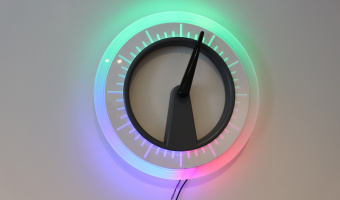
Maker project by iot design shop of a clock-like physical visualization device. "The concept is that you'd hang a set of FizViz widgets in your office, workshop, or wherever you want to watch and share data that matters" Source: FizViz - Large Scale Physical Visualizations for your Stats! (video)

Added by: Aurélien Tabard, sent by: Romain Vuillemot. Category: Active physical visualization  Tags: ambient display, clock, gauge


2016 – Podium: Physical Competition Monitor

Podium is an internet connected device that uses real-time social data to show comparative rankings of a brand’s performance versus their competitors. Developed in a partnership between iSketchLab and TrackMaven, Podium is a physical device that pulls Facebook, Instagram, and Twitter data from airline brands and offers an snapshot overview of the brands' performance on social media. Sources: Podium

Added by: Aurélien Tabard. Category: Active physical visualization  Tags: business, social media


2017 – Hand-Crafted Magazine Infographics

Infographic designers at the National Geographic crafted a 3D physical visualization out of paper and colored cardboard in order to prepare a 2D infographic. Also see our entry on IBM's cosmograph. Source: Alberto Lucas López (2017) Handmade #dataviz (tweet).

Added by: Aurélien Tabard & Pierre Dragicevic. Category: Passive physical visualization  Tags: animation, hand-made, infographic