Tag: Jennifer Payne

1714 – Mercury Thermometer

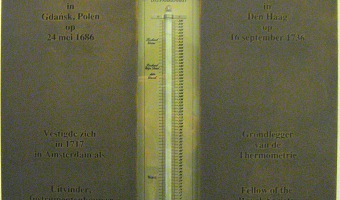
The mercury thermometer was invented by Dutch physicist Daniel Gabriel Fahrenheit in 1714. It consists of a narrow glass tube with a bulb at the bottom, containing mercury. The volume of mercury changes with temperature; mercury is driven out of the bulb and up the tube as the temperature rises. Sources: Wikipedia article on Mercury-in-glass thermometer Image Credit: Donar Reiskoffer, Wikimedia Commons

Added by: Jennifer Payne. Category: Measuring instrument  Tags:


2012 – Pulse: Tangible Line Graph

Pulse is a tangible line graph. It is composed of a string whose position is changed with six servo motors. By tilting the device, one can change between three information feeds. Pulse was created by designers Jon McTaggert and Christian Ferrara. Source: Christian Ferrara and Jon McTaggert, cargocollective.com/Pulse

Added by: Jennifer Payne. Category: Active physical visualization  Tags: dynamic, line graph


2014 – Lego Senate

Built by Lance Ulanoff, this Lego representation tells the story of the 2014 US midterms. Red and blue Lego blocks represent the number of Democrat and Republican senate seats. The representation was updated over the evening of the election, as seats went to either Democratic or Republican candidates. Captions tell the story, indicating the time of seat wins and the names of senators. Source: Mashable, The Lego Senate: How the 2014 midterms played out, brick by brick

Added by: Jennifer Payne & Samuel Huron. Category: Passive physical visualization  Tags: LEGO, politics, stop motion animation, storytelling


2014 – Physical Visual Sedimentation

This visualization created by Jennifer Payne and inspired by Samuel Huron's visual sedimentation was created from gumballs, an acrylic (plexiglass) box and adjustable foamcore bin dividers. Huron's work is inspired by the physical process of sedimentation. The above figures illustrate a participatory representation of hours of sleep for a university population, with different colours of gumballs representing different groups present on a university campus (i.e. blue gumballs for graduate […]

Added by: Jennifer Payne. Category: Passive physical visualization  Tags: participatory, visual sedimentation


2015 – Participatory Representation of Happiness

This 2015 physicalization was part of designer Stefan Sagmeister's exhibit on happiness. It contains a participatory representation of exhibition viewer's happiness, remiscent of Hans Haacke's MOMA poll (1970) and Lucy Kimball's participatory chart (2006). The units which make up the representation are gumballs, like Jennifer Payne's participatory representation (2014). Sources: Stefan Sagmeister (2015) The Happy Show Myles Constable (2015) The Happy Show asked "How Happy Are You? The results […]

Added by: Jennifer Payne. Category: Passive physical visualization  Tags: participatory


2015 – Canadian Federal Election Explained with LEGOs

On Canadian national news, Toronto-based artist and organiser Dave Meslin used LEGO bricks to illustrate the results of the 2015 federal election. He shows election results based on a first-past-the-post system, and compares them to a representation illustrating what results would look like if based on proportional representation. Source: CBC News (2015) If Canada had proportional representation: Dave Meslin shows with Lego.

Added by: Jennifer Payne. Category: Passive physical visualization  Tags: LEGO, politics, storytelling