This data physicalization is an art installation that represents the difference in disability-free life expectancy* and overall life expectancy for different areas in the UK, thereby highlighting the unequal health conditions in the country. Each area is represented by a hanging thread. On each thread a red bottle corresponds to disability-free life expectancy while the blue bottle represents overall life expectancy. The title of the artwork refers to the finding that in the UK there is gap of […]
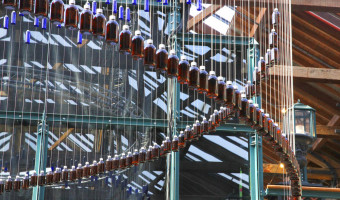
This data physicalization is an art installation that represents the difference in disability-free life expectancy* and overall life expectancy for different areas in the UK, thereby highlighting the unequal health conditions in the country. Each area is represented by a hanging thread. On each thread a red bottle corresponds to disability-free life expectancy while the blue bottle represents overall life expectancy. The title of the artwork refers to the finding that in the UK there is gap of just over 20 years between the lowest and highest average disability-free life expectancy. The artwork was created by SRG Bennett and Cath Sleeman and first shown at FutureFest 2018 in London. Source: SRG Bennett and Cath Sleeman (2018) The 20 Year Gap. * "the number of years a person can expect to live without a limiting persistent illness or disability"