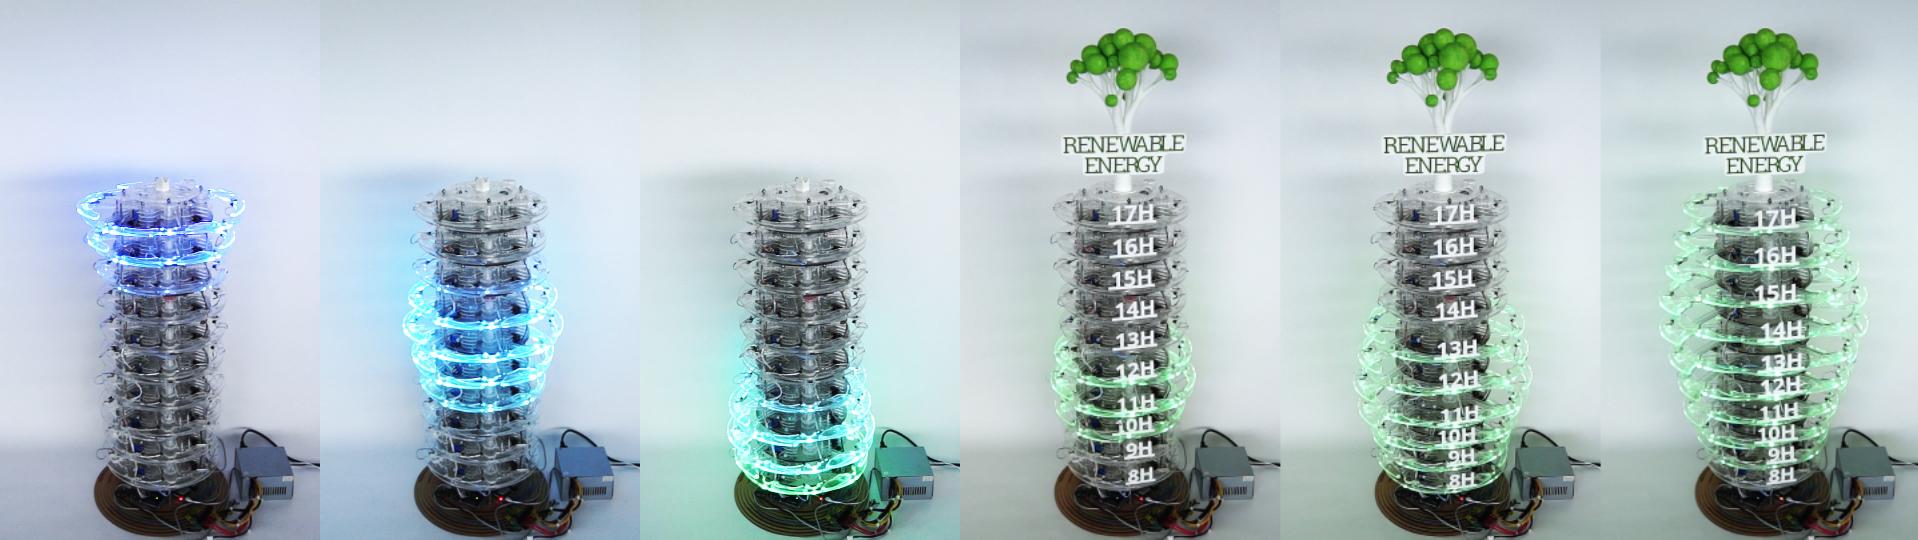
CairnFORM is a stack of expandable illluminated rings for display that can change of cylindrical shape (e.g., cone, double cone, bicone, cylinder, spheroid). CairnFORM can be used as a dynamic physical ring chart for encoding 360°-readable data: we use it for encoding forecast data about renewable energy availability in collective and public spaces, such as public places and workplaces.
Source: Maxime Daniel, Guillaume Rivière, and Nadine Couture (2019) CairnFORM: a Shape-Changing Ring Chart Notifying Renewable Energy Availability in Peripheral Locations.
Added by: Maxime Daniel.
Category:
Active physical visualization
Tags:
renewable energy, self-actuated, shape-changing interfaces