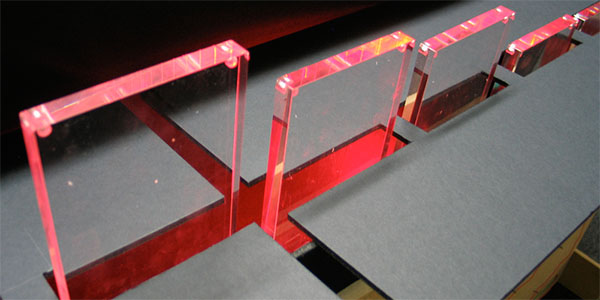
Ten actuated bar charts that show the popularity of keywords of interest in news articles over time, made by the company Tinker from London. A separate search interface is provided on a regular desktop computer and sends queries to the Google News Archive. It is permanently installed in the St Paul's School for Boys Computing Department in London.
Sources:
Added by: Pierre Dragicevic.
Category:
Active physical visualization
Tags:
bar charts, news, temporal data