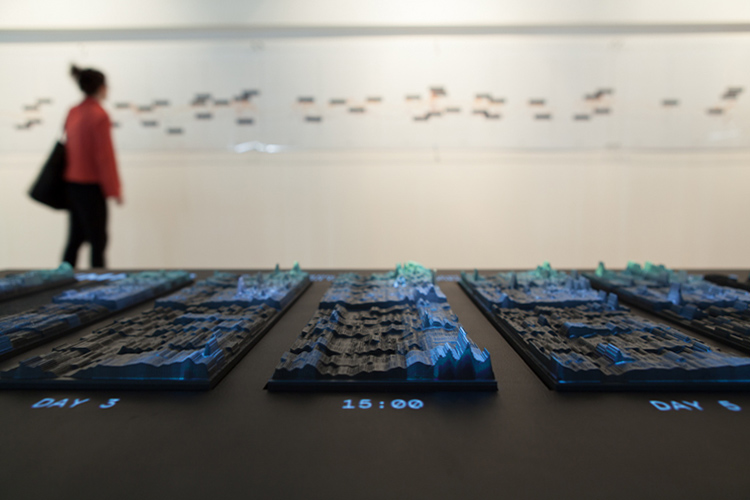
The core of the installation is a physical data sculpture consisting of 17 objects, each representing all Tweets we have collected during one day of the Olympics. Mapped onto this physical sculpture we have then projected individual heat maps for the most interesting themes we have identified while observing emoto during the Games. Users were able to navigate through these themes using an interactive controller and thus explore our archive.
Source: Moritz Stefaner, Drew Hemment & Studio NAND. Emoto.
Added by: Yvonne Jansen, sent by: Fanny Chevalier - Romain Vuillemot.
Category:
Active physical visualization
Tags:
data sculpture, heatmap, online data