
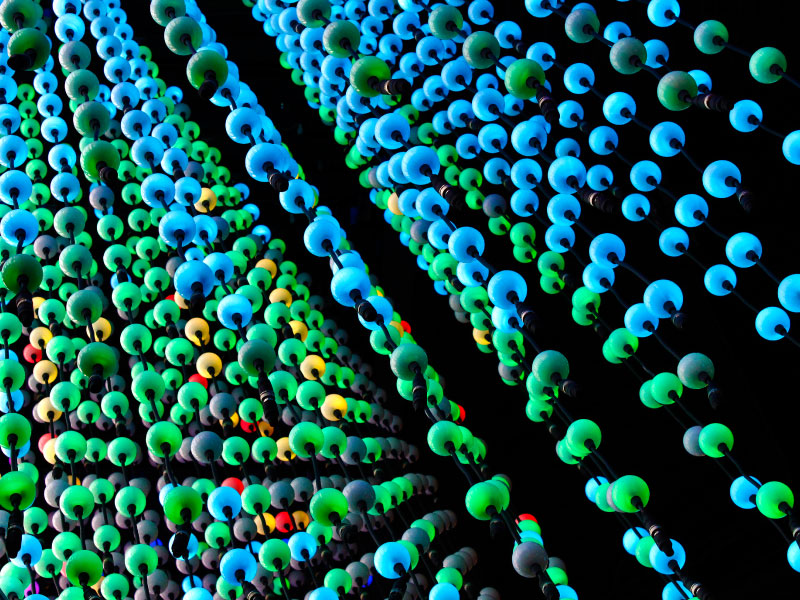
Lake Brite is a data visualization project which allows the public to learn about Lake Champlain through a display of 7,500 LED’s. From temperature statistics to animal life, Lake Brite will encourage interaction and data literacy, connecting everyone around the common cause of Lake Champlain health.
Sources: ECHO, Leahy Center for Lake Champlain; www.echovt.org/lakebrite
Added by: Loren Madsen, sent by: Melinda Haas.
Category:
Interactive installation
Tags: