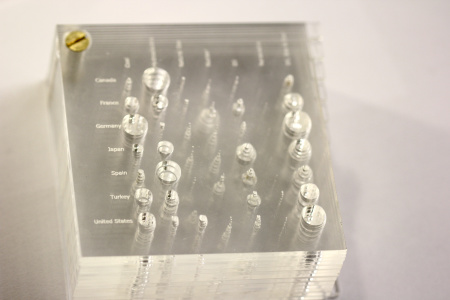
A series of stacked 2D plots showing changes in energy sources for different countries by PhD student Simon Stusak from University of Munich. All plots are cut from acrylic and hold together in one corner to facilitate alignment of the layers. The y-axis is mapped to countries, the x-axis to different energy sources, and the z-axis to time.
Sources:
- Simon Stusak (2013) Physical Visualizations: An Exploration.
- Simon Stusak, Aurélien Tabard and Andreas Butz (2013) Can Physical Visualizations Support Analytical Tasks?
Added by: Yvonne Jansen, sent by: Pierre Dragicevic.
Category:
Passive physical visualization
Tags:
lasercut, rearrangeable, stacked 2D