Tag: Benjamin Bach

1200 – Pop-Up and Movable Books

While gatefold mechanisms were already used in the 1100s, one of the first movable paper mechanisms was a volvelle created by Benedictine Monk Matthew Paris to calculate the dates of Christian holidays in his book Chronica Majorca (1236-1253, see left image above). Volvelles are paper discs or rings placed on top of each other that rotate around a string or rivet. Many other types of paper mechanisms have been invented since then, such as flaps, which were used in anatomy books starting from […]

Added by: Pierre Dragicevic, sent by: Benjamin Bach. Category: Enabling technology  Tags: anatomy, book, mechanical interaction, paper, pop-up


1979 – Great Polish Map of Scotland

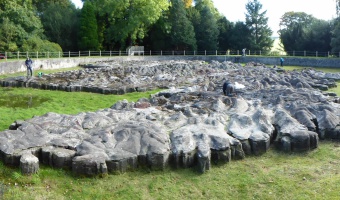
The "Great Polish Map of Scotland" is a 50 x 40 m concrete terrain model of Scotland. It was built by a Polish sergeant who stationed in Scotland during WWII and ended up living there. It is claimed to be the world's largest terrain model, although the Chinese built a 900 x 700 m model in 1999. Source: Atlas Obscura. Great Polish Map of Scotland.

Added by: Pierre Dragicevic, sent by: Benjamin Bach. Category: Physical model  Tags: cartographic, scotland, terrain model, walkable


2003 – Time Pieces: Physical Space-Time Cubes

Artist Marilynn Taylor created seven three-dimensional maps (one for each day of the week) in which time is the z-axis and a copper wire shows how she moved across the city during the day. Source: Maryline Taylor (2003) Time pieces - Mapping the time and space of place (2003 version).

Added by: Pierre Dragicevic, sent by: Benjamin Bach. Category: Passive physical visualization  Tags: hand-made, temporal data


2013 – Flip Books Rather Than Movies

Cell biologist Jessica Polka discusses the benefits of making flip books to bring to scientific conferences: With the advent of smartphones and tablets, bringing movies to poster sessions is becoming more common than ever before. Even so, a low-tech flip book is still a lot more fun for visitors to use, and it's easier to pass around a large group. When the session's over, a flip book can live at your bench indefinitely, ready for visitors with no boot time. Source: Jessica Polka (2013) Hands […]

Added by: Pierre Dragicevic, sent by: Benjamin Bach. Category: Other  Tags: animation, flip book, science


2013 – Pneumatic Charts

The Hive Big Data Think Tank at Palo Alto created a device for visualizing city data (power, waste, demographic, transportation) using blowers, microcontrollers and ping pongs balls. Sources: Lance Riedel, Christophe Briguet, Srinivas Doddi, Daniel Schwartz, Pashu Christensen, The Hive @City Camp Palo Alto for the National Day of Civic Hacking! Svetlana Sicular (2013) Now Open.

Added by: Pierre Dragicevic, sent by: Benjamin Bach. Category: Active physical visualization  Tags: city data, ping pong ball, pneumatic


2016 – Thoughtforms: 3D-Printed Thoughts

Kellyann Geurts and In Dae Hwang, Monash University, give physical shape to thoughts by turning EEG data into solid objects. During three public events at Melbourne in 2016, she placed a mobile EEG device on volunteers and asked them to think of a memory or emotion of their choice. Their EEG output was translated in real time into a 3D shape they could see on a computer screen. Participants could then press a button to pause the shape and send it to a 3D printer. They were then invited to write […]

Added by: Pierre Dragicevic, sent by: Benjamin Bach. Category: Passive physical visualization  Tags: 3d printing, digital fabrication, EEG, thoughts


2016 – Walkable Collaboration Network

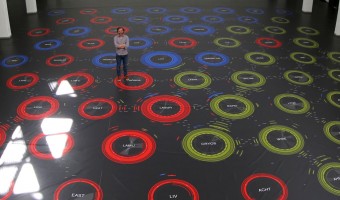
Designer Dario Rodighiero created a large (15x15m) walkable visualization showing scientific relationships between researchers and laboratories at the ENAC school of EPFL in Switzerland. The visualization was printed on tarpaulin, a heavy covering employed for trucks. Two years before, Dario created a coauthorship network visualization for the Digital Humanities 2014 conference. He initially considered showing a large poster, but since sticking posters was not allowed at the conference center, […]

Added by: Pierre Dragicevic, sent by: Benjamin Bach. Category: Uncertain  Tags: collaboration, network, walkable


2021 – Walkable Bar Chart

A bar chart conveying two quantities, one of which is clearly larger. The activists and artists at the Respect New Haven rally yesterday offered this stunning graphic to visualize Yale's $32 Billion endowment compared to its paltry $13 million contribution to the city of New Haven...a FRACTION of the taxes it would pay if properly assessed. Also see our other entries on walkable physical visualizations. Source: Tweet from Davarian L. Baldwin.

Added by: Pierre Dragicevic & Yvonne Jansen, sent by: Benjamin Bach. Category: Passive physical visualization  Tags: walkable, city, politics, taxes, bar chart, street, paint


2025 – Digitally-Fabricated Visualizations of the Future

These images have nothing to do with physical visualizations: they are not data-driven but abstract, and they are not even physical but instead photo-realistic computer-generated images. However, these images from digital artist Lee Griggs give an idea of what physical visualizations may look like in the near future once we overcome the limitations of today's digital fabrication technology: they will be visually and haptically elaborate, colorful, rich, and beautiful. Make sure you look at the […]

Added by: Pierre Dragicevic, sent by: Benjamin Bach. Category: Enabling technology  Tags: future