Tag: Fanny Chevalier

1871 – Thermodynamic Surfaces

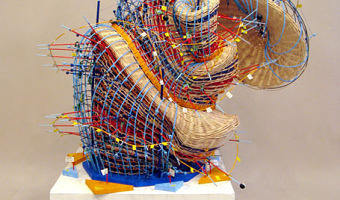
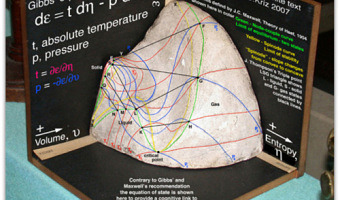
A physical visualization by Scottish physicist James Maxwell (left), constructed over the course of about seven months, from November 1874 to July 1875, based on the descriptions of thermodynamics surfaces described in two 1873 papers by American engineer Willard Gibbs. The molded shape depicts the geometry of the three-dimensional thermodynamic surface of the various states of existence of water: solid, liquid, orgas, shown on Cartesian coordinates of the entropy (x), volume (y), and energy […]

Added by: Yvonne Jansen, sent by: Fanny Chevalier. Category: Passive physical visualization  Tags: clay, Maxwell, science, thermodynamics, Thompson


2004 – Cylinder: Early Sound Sculpture

Cylinder by Andy Huntington and Drew Allan may be one of the first digitally-fabricated sound sculptures. Also see our entry 2007 - Explosion of sound sculptures. Source: http://extraversion.co.uk/2003/cylinder/

Added by: Pierre Dragicevic, sent by: Fanny Chevalier. Category: Passive physical visualization  Tags: 3d printing, digital fabrication, sound, sound sculpture, temporal data


2005 – Tactile Rubik’s Cubes

An online article compares several different designs for tactile Rubik's Cubes created between 2005 and 2010. Left image: different objects on the outside of the cube give each side a different feel. Right image: laser-cut shapes. Source: Smithsonian magazine.

Added by: Yvonne Jansen, sent by: Fanny Chevalier. Category: Other  Tags: laser-cut, rearrangeable, tactile


2006 – Nathalie Miebach's Woven Sculptures

Artist Nathalie Miebach created a range of beautiful woven sculptures out of weather data. Source: Nathalie Miebach. http://www.nathaliemiebach.com/weather.html (see TED Talk).

Added by: Pierre Dragicevic, sent by: Fanny Chevalier. Category: Passive physical visualization  Tags: artistic, data sculpture, hand-made, weather


2009 – In-Formed: More Data-Driven Tableware

Another data-driven tableware, this time conveying world statistics. The fork on the image shows calories consumption for the US and three other countries. Source: Nadeem Haidary.

Added by: Yvonne Jansen, sent by: Fanny Chevalier. Category: Passive physical visualization  Tags: data sculpture, tableware, world statistics


2010 – eCLOUD & airFIELD: Ambient Airport Visualizations

Left image: eCLOUD is an airport installation at the San Jose International Airport created by Dan Goods, Nik Hafermaas, and Aaron Koblin. It is made of many large LCD pixels laid out in 3D space whose opacity change as a function of weather. Right image: A similar installation called airFIELD was created by the same team two years later. It shows air traffic and is installed at the Hartsfield-Jackson Atlanta International Airport. For other examples of non-regular or 3D layouts of physical […]

Added by: Pierre Dragicevic, sent by: Fanny Chevalier. Category: Active physical visualization  Tags: air traffic, hybrid, weather


2010 – Relational Ornaments: Networks Shown with Textile

Textile art based on the network maps of Valdis Krebs. Gundega Strautmane, a Latvian textile artist and designer, visualizes social and physical networks in a show called Relational Ornaments. The networks are created using various sized pins to depict nodes and threads connecting them to show relationships. Bringing visualization into the tactile world lends it a weight not able to be achieved on a computer screen. It allows the viewer to pause, spend time with the information, feel it, sense […]

Added by: Jean-Daniel Fekete, sent by: Fanny Chevalier. Category: Passive physical visualization  Tags: network data, textile


2012 – A Soft and Transparent Handleable Protein Model

This report demonstrates the viability of a new handleable protein molecular model with a soft and transparent silicone body similar to the molecule’s surface. A full-color printed main chain structure embedded in the silicone body enables users to simultaneously feel the molecular surface, view through the main chain structure, and manually simulate molecular docking. The interactive, hands-on experience deepens the user’s intuitive understanding of the complicated 3D protein structure and […]

Added by: Pierre Dragicevic, sent by: Fanny Chevalier. Category: Enabling technology  Tags: 3d printing, chemistry, proteine model


2012 – Grand Old Party: Political Satire

American designer Matthew Epler shows how to build physical visualizations out of silicone using 3D printing and mold casting. He also shows how to use them to make political statements. Source: Matthew Epler (2012) Grand Old Party (video here).

Added by: Pierre Dragicevic, sent by: Fanny Chevalier. Category: Passive physical visualization  Tags: 3d printing, adult toy, digital fabrication, extruded 2d, moulding, opinion polls, politics, satire, silicone


2012 – General Motors' 3D LEGO Visualizations

LEGOs help business executives log and explore data. Sources: Mark Wilson (2012) How GM Is Saving Cash Using Legos As A Data Viz Tool. The Daily Drive (2012) GM Plays with Legos (Video).

Added by: Pierre Dragicevic, sent by: Fanny Chevalier. Category: Passive physical visualization  Tags: industry, interactive, LEGO, manual update, pragmatic visualization, rearrangeable