Tag: Samuel Huron

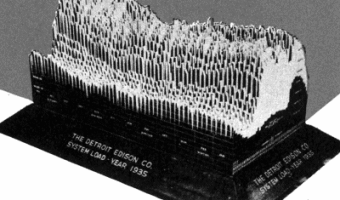
1935 – 3D Visualizations of Power Consumption

A large 3D physical visualization made by the Detroit Edison Company showing electricity consumption for the year 1935, with a slice per day and each day split into 30 min intervals. Two other examples from different Edison electricity companies are discussed in Brinton's book. These physical visualizations seem to have been used to better anticipate power demands. Also see our entry 1951 - Electricity Generated or Demanded. Sources: Willard Cope Brinton (1939) Graphic Presentation pp 354-355. […]

Added by: Yvonne Jansen & Pierre Dragicevic, sent by: Samuel Huron. Category: Passive physical visualization  Tags: Brinton, electricity consumption, temporal data


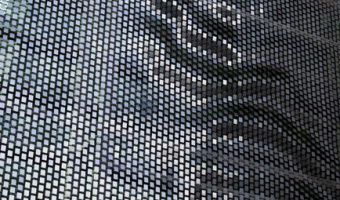
1996 – Ned Kahn's Wind-Visualizing Facades

Since 1996, Nothern California artist Ned Kahn creates large-scale installations that visualize wind patterns. The left image shows Wind veil (2000), a facade of a parking garage covered with 80,000 small aluminum panels that are hinged to move freely in the wind. The right video shows Wind arbor (2011), a facade of a hotel lobby in Singapore covered with a cable net structure composed of a half a million hinged elements. Sources: List of Ned Kahn's wind sculptures on his website. David Mather […]

Added by: Pierre Dragicevic, sent by: Samuel Huron. Category: Passive physical visualization  Tags: embedded, facades, wind, wind sculpture, walkable


2013 – Season in Review: iPad + Physical Charts Show Baseball Stats

Baseball stats for an entire season created by Teehan+Lax labs as a combination of an interactive ipad app with an overlay of physical charts cut from acrylic. Depending on the current choice in the app, the edges of different charts get highlighted by the ipad. Source: Teehan+Lax labs & vimeo.

Added by: Yvonne Jansen, sent by: Samuel Huron. Category: Active physical visualization  Tags: baseball, digital fabrication, hybrid, laser cutting, line charts, tablet, temporal data


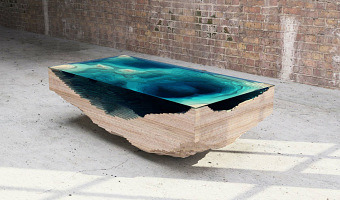
2014 – Abyss Table - Scale Model of Deep Sea as Furniture

This table created by the furniture design company Duffy London is a geological cross-section of the sea shown with layered wood and glass sheets. Designer Christopher Duffy got the idea while visiting a glass factory and noticing that glass sheets darken as more layers as added, as does the sea. You can have this piece of furniture at home for £9,800. Sources: Duffy London (2014) Abyss Table. Nina Azzarello (2014) Duffy London layers the abyss table to look like ocean depths.

Added by: Pierre Dragicevic, sent by: Samuel Huron. Category: Physical model  Tags: cartographic, cartography, commercial, furniture, geography, sea