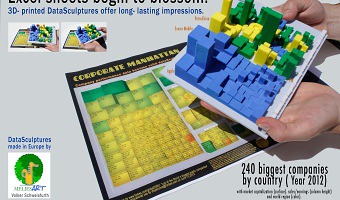
Left image: A 3D printed version of the "Forbes 2000" list showing the 240 largest companies, by Volker Schweisfurth. Market value is mapped to surface area, sales volume is mapped to volume, and the continent from which the company originates is mapped to color (America (blue), Europe (green), Asia (yellow)). The picture illustrates how a physical model of this 3D visualization gives a better impression of perspective than the printed perceptual cues in the original paper visualization. Right […]
Left image: A 3D printed version of the "Forbes 2000" list showing the 240 largest companies, by Volker Schweisfurth. Market value is mapped to surface area, sales volume is mapped to volume, and the continent from which the company originates is mapped to color (America (blue), Europe (green), Asia (yellow)). The picture illustrates how a physical model of this 3D visualization gives a better impression of perspective than the printed perceptual cues in the original paper visualization. Right image: Other physical visualizations from Volker Schweisfurth showing showing city and country indicator data. They were all 3D-printed using a multi-color 3D printer. Source: Volker Schweisfurth. Check out his new website http://www.meliesart.de
Added by: Yvonne Jansen, sent by: Volker Schweisfurth.
Category:
Passive physical visualization
Tags:
3d printing, statistical data