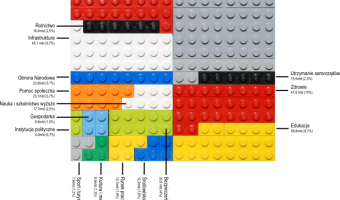
An area chart created with LEGO bricks. Each colour presents a single domain in the 2011 Polish budget. Source: Przemyslaw Biecek (2012) SmarterPoland.
An area chart created with LEGO bricks. Each colour presents a single domain in the 2011 Polish budget. Source: Przemyslaw Biecek (2012) SmarterPoland.
Added by: Przemyslaw Biecek.
Category:
Passive physical visualization
Tags:
area chart, budget, LEGO