Tag: Brinton

1913 – Frankfurt Streetcar Load

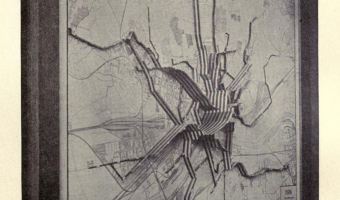
Strips of woods glued on top of each other convey the average number of passengers carried between two stops. Each strip corresponds to 4,000 passengers. Shown at the 1913 International building trade exhibition in Leipzig. Source: Willard Cope Brinton (1914) Graphic Methods for Presenting Facts pp 224-226.

Added by: Pierre Dragicevic. Category: Passive physical visualization  Tags: Brinton, cartographic


1933 – IBM's Cosmograph

The left image above shows a physical flow chart (Sankey diagram) made of 1000 sheets of paper. It was not meant to be directly read, but to be photographed (see right image). The physical apparatus, called Cosmograph, allowed people without graphic skills to easily produce nice-looking Sankey diagrams. It was copyrighted by IBM in 1933 and sold for $50. Sources: Willard Cope Brinton (1939) Graphic Presentation, p. 78. Jim Strickland (2012) Cosmograph? What's a Cosmograph?

Added by: Pierre Dragicevic. Category: Passive physical visualization  Tags: Brinton, cosmograph, flow chart, Sankey diagram


1934 – Ford's Globe

A large rotating relief globe showing Ford company's industrial sites around the word, exhibited at the Chicago World's Fair in 1934. Sources: Willard Cope Brinton (1939) Graphic Presentation, p. 160. The Henry Ford Blog (2013) Ford at the Fair. More photos from the Henry Ford Online Collection.

Added by: Pierre Dragicevic. Category: Physical model  Tags: Brinton, cartographic, globe, walkable


1935 – 3D Visualizations of Power Consumption

A large 3D physical visualization made by the Detroit Edison Company showing electricity consumption for the year 1935, with a slice per day and each day split into 30 min intervals. Two other examples from different Edison electricity companies are discussed in Brinton's book. These physical visualizations seem to have been used to better anticipate power demands. Also see our entry 1951 - Electricity Generated or Demanded. Sources: Willard Cope Brinton (1939) Graphic Presentation pp 354-355. […]

Added by: Yvonne Jansen & Pierre Dragicevic, sent by: Samuel Huron. Category: Passive physical visualization  Tags: Brinton, electricity consumption, temporal data


1939 – Map of Great Britain's Marine Trade

A physical World map made of copper and glass showing the size of Great Britain's merchant marine and the main trade routes as 9,000 miniature ship models. Exhibited at the New York World Fair in 1939. Sources: Willard Cope Brinton (1939) Graphic Presentation, p. 207. Life Magazine (1939) New York Opens the Gates to the World of Tomorrow. Vol. 6, No. 20, May 15 1939.

Added by: Pierre Dragicevic. Category: Passive physical visualization  Tags: Brinton, cartographic, cartography