Tag: deaths

1973 – Mazamet Ville Morte

In 1973, the French town of Mazamet had a population that closely matched the nationwide number of motor vehicule deaths across the previous year. A TV reporter decided to show all inhabitants lying on the floor to symbolize these deaths. Source: Marieaunet (2010) 1973 Mazamet ville morte.

Added by: Pierre Dragicevic, sent by: Charles Nepote. Category: Passive physical visualization  Tags: deaths, participatory, people, rearrangement, single-datum


2004 – Worry (Prayer) Beads

One bead = one year. Size of colored beads is proportional to number of terrorist-caused deaths. Black beads = no terrorist deaths. The largest bead is 2001. Also see Loren Madsen's earlier piece Tops (2001) featuring the same dataset, our entry 1995 – Loren Madsen’s Early Data Sculptures, and our interview with the artist. Sources: Loren Madsen


2004 – Of All the People in All the World: Stats with Rice

Since around 2004 the British group of artists Stan’s Cafe is creating data landscapes all over the world by mapping each grain of rice to a person in order to convey various statistics such as city populations or deaths in the holocaust. The size and theme of the show change depending on the location. The largest one involved 104 tons of rice. Rice is weighted manually in small quantities and manually poured over piles. This labor-intensive process is part of the show. Sources: Stan's […]


2010 – and Counting... Tattoo of War Casualties

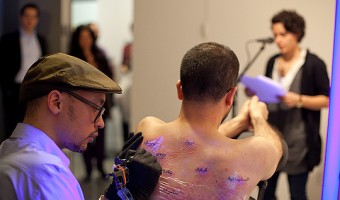
Wafaa Bilal’s brother, Haji, was killed by a missile at a checkpoint in their hometown of Kufa, Iraq in 2004. Bilal feels the pain of both American and Iraqi families who have lost loved ones in the war, but the deaths of Iraqis like his brother are largely invisible to the American public. and Counting… addresses this double standard as Bilal turns his own body — in a 24-hour live performance — into a canvas, his back tattooed with a borderless map of Iraq covered with one dot for each Iraqi […]

Added by: Aarati Akkapeddi. Category: Passive physical visualization  Tags: body, cartographic, deaths, interactive, performance, tattoo, war


2014 – 888,246 Ceramic Poppies to Commemorate Fallen Soldiers in WW1

Don't miss the major art installation Blood Swept Lands and Seas of Red at the Tower of London, marking one hundred years since the first full day of Britain's involvement in the First World War. Created by ceramic artist Paul Cummins, with setting by stage designer Tom Piper, 888,246 ceramic poppies will progressively fill the Tower's famous moat over the summer. Each poppy represents a British military fatality during the war. The poppies will encircle the iconic landmark, creating not only a […]

Added by: Yvonne Jansen, sent by: Dan Hagon. Category: Passive physical visualization  Tags: ceramics, deaths, ephemeral, remembrance day, single-datum, walkable


2017 – The All Too Evident Ashtray

The ATEA is an ashtray made of concrete. It carries data about smoking habits & lung cancer in the United States between 1975 and 2014, split by gender. The data is encoded in concentric bubbles/half spheres, where the distance to the center shows lung cancer prevalence by year. The bubble diameters display the average number of cigarettes smoked per day during that particular year. The causal relationship between smoking and cancer is well researched and known for decades, so there’s […]

Added by: Michael Stanka. Category: Passive physical visualization  Tags: ashtray, data object, deaths, risk, smoking


2019 – Hostile Terrain 94: Deaths at the US/Mexico Border

Prototype of a series of physical maps that will be exhibited across 94 cities worldwide in fall 2020. Each of the 3500 hand-written toe tags represents the recovered body of a migrant who died while crossing the US/Mexico border in the Sonoran Desert between 2000 and 2020. Coordinated by the Undocumented Migration Project (UMP). To learn more about UMP and the context of this map, listen to the Radiolab podcast series Border Trilogy. Sources: hostileterrain94.wordpress.com Left image from […]

Added by: Pierre Dragicevic, sent by: Luiz Augusto de Macêdo Morais. Category: Passive physical visualization  Tags: cartographic, deaths, migration, toe tag


2019 – New Worry Beads: Deaths from Terrorism

Worry Beads, one for every year from 1945 (closest in the pic), are scaled at one cc per human life. The volume of each is set by the number of terrorist-caused deaths for that year globally. The whole thing is about 40' long, the largest bead (2014) is 19" dia. There’s other material which hopefully makes clear that the #1 American fear, terrorist attack, is ridiculous. There’s another string of beads, 50" long, which shows terrorist deaths in the US. You’re more likely to be […]

Added by: Pierre Dragicevic, sent by: Loren Madsen. Category: Passive physical visualization  Tags: beads, deaths, terrorism


2020 – COVID-19 Deaths as Nails

An art installation in the Cathedral of Schwäbisch Gmünd (Germany) shows COVID-19 deaths as nails hammered into wooden cubes. More nails are added as the number of deaths increase. The text down the steps says "Fürchtet euch nicht", meaning "do not be afraid". Also see our other entries on single-datum physical visualizations and on conveying deaths. Sources: Tweet from Friedrich Hart (@mxfh), Dec 9, 2020. SWR (2020) Schwäbisch Gmünd: 13.000 Nägel für Coronaopfer.

Added by: Pierre Dragicevic, sent by: Friedrich Hart. Category: Passive physical visualization  Tags: covid-19, deaths, nails, people, single-datum