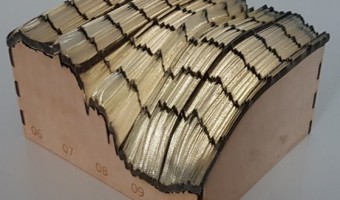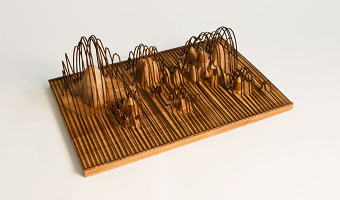
Andreas Nicolas Fischer is a Berlin-based artist. Above are four of his 3-D data sculptures: Fundament (world GDP and derivatives volume) Indizes (finance data over time) A week in the life (cellphone communications) Reflection (FFT of a music piece). Source: http://anfischer.com via infosthetics.
Andreas Nicolas Fischer is a Berlin-based artist. Above are four of his 3-D data sculptures: Fundament (world GDP and derivatives volume) Indizes (finance data over time) A week in the life (cellphone communications) Reflection (FFT of a music piece). Source: http://anfischer.com via infosthetics.
Added by: Pierre Dragicevic.
Category:
Passive physical visualization
Tags:
cellphone, country indicators, data sculpture, finance, sound, sound sculpture