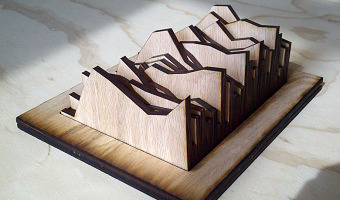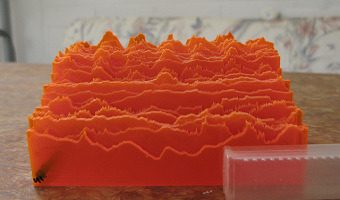
Temperature measurements in Helsinki from May 2009 to May 2010. Each row is one week long. Source: Miska Knapek, see flickr photoset.
Temperature measurements in Helsinki from May 2009 to May 2010. Each row is one week long. Source: Miska Knapek, see flickr photoset.
Added by: Pierre Dragicevic.
Category:
Passive physical visualization
Tags:
digital fabrication, laser cutting, temporal data, time series, weather