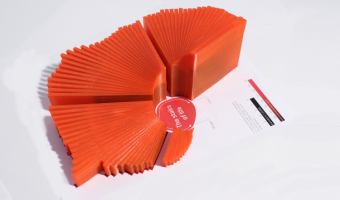
Left image: data sculpture by Dutch designer Matthijs Klip showing life expectancy of the Netherlands population. Each bar maps to an age; the bar's height represents life expectancy while its length represents the amount of people having that age. Right image: other designs by Matthijs Klip. Source: Matthijs Klip (2012) Physical Information Design.
Left image: data sculpture by Dutch designer Matthijs Klip showing life expectancy of the Netherlands population. Each bar maps to an age; the bar's height represents life expectancy while its length represents the amount of people having that age. Right image: other designs by Matthijs Klip. Source: Matthijs Klip (2012) Physical Information Design.
Added by: Pierre Dragicevic.
Category:
Passive physical visualization
Tags:
3d printing, data sculpture, digital fabrication, life expectancy