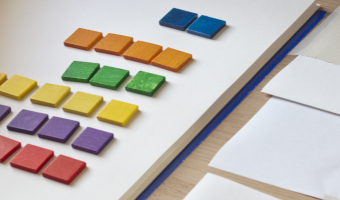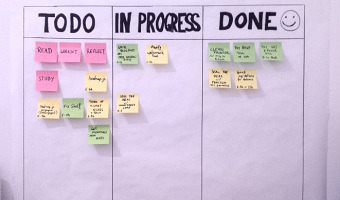
A Kanban board is a task management tool where sticky notes representing work items are moved across a board to reflect their state of advancement. The simplest form has three states: to do, in progress, and done (left image). A Kanban board provides a visual overview over all work items that makes it possible to rapidly spot time management issues, such as too many items in progress. Although software versions exist, many people prefer Kanban boards to be physical. Several recent blog posts […]
A Kanban board is a task management tool where sticky notes representing work items are moved across a board to reflect their state of advancement. The simplest form has three states: to do, in progress, and done (left image). A Kanban board provides a visual overview over all work items that makes it possible to rapidly spot time management issues, such as too many items in progress. Although software versions exist, many people prefer Kanban boards to be physical. Several recent blog posts (links below) discuss the benefits of physical Kanban boards, e.g., they are 1) always available and visible, unavoidable; 2) flexible and expressive, easy to customize; 3) easy and engaging to use - moving items forward can be rewarding; 4) in teams, can promote engagement, encourage conversations, create a spirit of common purpose. Drawbacks include the absence of support for synchronization at a distance, history management, constraint enforcement, post-processing and calculations, and they only provide a finite working space. Hybrid solutions like JimFlow (2012) are commercialized that try to combine the best of both worlds. Hybrid boards (although not Kanban) have also been explored in the field of tangible user interfaces, e.g., by Jacob et al. (2002). Sources: Wikipedia article on the Kanban Board. Nilesh R Arora (2001) Kanban Guide - Demand Scheduling for Lean Manufacturing, p.11. Arnaldo Pellini (2011) Personal Kanban and two simple rules to manage knowledge work. Siddharta Govindaraj (2011) 5 Reasons Why Physical Boards Are Better Than Electronic Boards. Cheryl Hammond (2013) Kanban boards: physical or virtual? Patrick Wied (2014) Getting physical with Productivity - A simple, yet powerful approach. Left image by Patrick Wied. Right image by Chris Huffman.