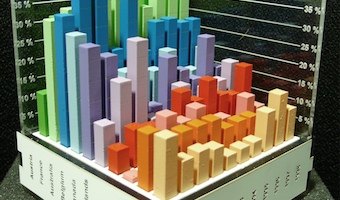
These physical bar charts, showing the evolution of country indicators over time, were used to conduct the first empirical study showing that physical visualizations can outperform their on-screen counterparts for data retrieval tasks. Sources: Yvonne Jansen, Pierre Dragicevic and Jean-Daniel Fekete (2013) Evaluating the Efficiency of Physical Visualizations. Also see Yvonne Jansen's PhD dissertation on Physical and Tangible Information Visualization (2014).
These physical bar charts, showing the evolution of country indicators over time, were used to conduct the first empirical study showing that physical visualizations can outperform their on-screen counterparts for data retrieval tasks. Sources: Yvonne Jansen, Pierre Dragicevic and Jean-Daniel Fekete (2013) Evaluating the Efficiency of Physical Visualizations. Also see Yvonne Jansen's PhD dissertation on Physical and Tangible Information Visualization (2014).