Mount Saint Helens is an active volcano located in the north-west of the United States. In an eruption in 1980, the upper section of the volcano was destroyed, reducing the peak's elevation from 2950 m to 2549 m. This two-part 3D printed model of Mount Saint Helens visualizes the dramatic change that occurred over a very short period of time. The digital data for 3D printing and the white and red model were prepared by Drew Thompson, the green model was printed by Jeppe Vestergaard. Sources: […]
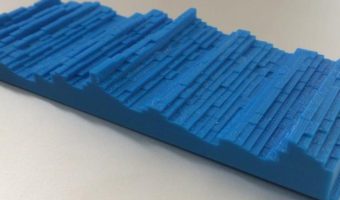
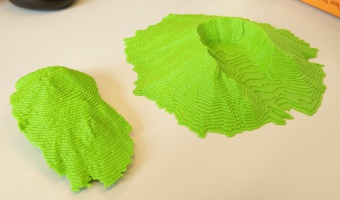
Mount Saint Helens is an active volcano located in the north-west of the United States. In an eruption in 1980, the upper section of the volcano was destroyed, reducing the peak's elevation from 2950 m to 2549 m. This two-part 3D printed model of Mount Saint Helens visualizes the dramatic change that occurred over a very short period of time. The digital data for 3D printing and the white and red model were prepared by Drew Thompson, the green model was printed by Jeppe Vestergaard. Sources: Drew Thompson (Tree_House_Fire) Thingiverse Thing 581011 Jeppe Vestergaard (jeppev) Thingiverse Make 210362
Added by: Juernjakob Dugge.
Category:
Physical model
Tags:
3d printing, cartographic, temporal visualization