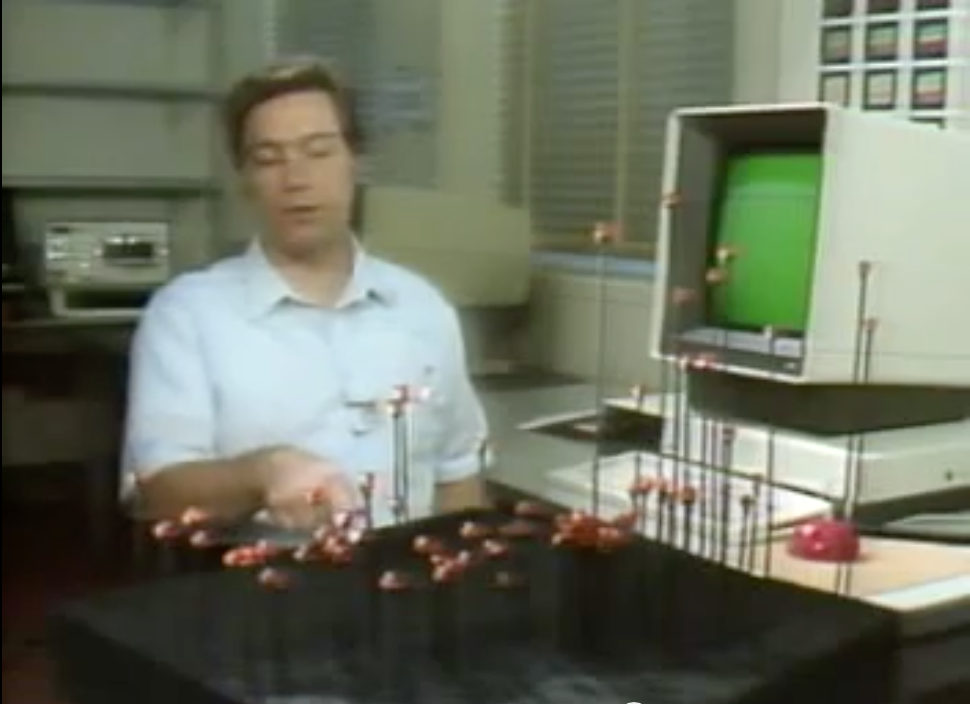
In this 1985 video, Rick Becker from AT&T Bell Labs explains the concept of "dynamic graphics". Already in the early 70s, statisticians like John Tukey were starting to experiment with multidimensional data visualization on flat computers screens, including 3D data visualizations that could be interactively rotated to convey depth. This video shows how enthusiastic these people were to transition from the physical to the virtual. Nevertheless, it is interesting to see that Rick Becker felt the need to build a physical model to explain 3D scatterplots. Later in the video, he also uses a paper cube model to explain scatterplot matrices.
Sources:
- Becker and McGill (1985) Dynamic Displays of Data. AT&T Bell Laboratories's video library.
- See video on youtube
- See other videos.
Added by: Pierre Dragicevic.
Category:
Passive physical visualization
Tags:
3d scatterplot, statistical graphics