Tag: Anne-Laure Fréant

20000 BC – Ishango Bone

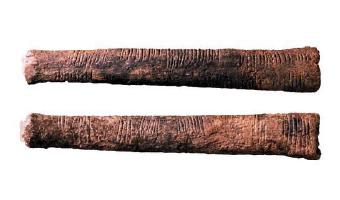
Before the earliest unambiguous numbers in Mesopotamia, there are earlier hints of prehistoric numbers. One is a 25,000-year-old bone from Ishango, a site on a river that flows into Lake Mwitanzige, part of the so-called headwaters of the Nile. This artifact bears three rows of marks that are divided into groups by wider spacing. The groups on the first row suggest the prime numbers between ten and twenty in ascending order; those of the second row suggest adding and subtracting one from ten […]

Added by: Anne-Laure Fréant. Category: Other  Tags: tally, bone, archaeology


2015 – Climate Datascapes

Artist Tali Weinberg is working since 2015 on extensive series of textile data-art documenting heat waves, water color variations, average temperatures, etc. On her website you can discover the dozen different pieces from the “Climate Datascape” series, as well as other data projects. I translate climate data from the National Oceanic and Atmospheric Administration into abstracted landscapes and waterscapes, materializing the data with plant-derived fibers and dyes and […]

Added by: Anne-Laure Fréant. Category: Passive physical visualization  Tags: textile, weaving, climate, environment, hand-made


2016 – Duo Tornado Vase

This work by the chinese designer Yisha Cai explores meteorological phenomena using digital data, conception and production tools. Especially interested in data visualization, Yisha Cai collected rain data through sensors and an arduino device. The data were then processed to generate a 3D model. The cylindrical clay tornado form was generated by code in a digital platform. It was subsequently printed in porcelain by a 3D ceramics printer. The accompanying glass globe form was shaped as a […]


2019 – Physical Globe Model of Global Temperature Change

Using open source NASA GISS data, british model maker and designer Matthew Stewart created a sculpture which communicates the temperature rise of the globe compared to 50 years ago. With the data’s lat/long variable, Matthew Stewart represented temperature increase with length of protruding rod – the greater the difference, the longer the rod. Made of 3,204 pieces, assembly had to be perfect to ensure the lattice structure held its form correctly, & so the data was represented accurately. […]

Added by: Anne-Laure Fréant. Category: Passive physical visualization  Tags: global warming, cartographic, globe, NASA, data sculpture


2021 – The Flood Necklace

The “Flood Necklaces” embeds flood history data of the river Loire in the city of Orleans. Each ball of clay is sized according to the water heights measured on flood scales between 1800 and 2003, in the city of Orleans. Data is from the Region Centre-Val-de-Loire (DREAL), for floods between 1804 and 2003. The biggest flood recorded happened in 1866, and impacted most rivers and regions of France. It was such a major event that a report to the Emperor has been written to estimate the damages […]

Added by: Anne-Laure Fréant. Category: Passive physical visualization  Tags: data jewellery, flood, Loire river, ceramics, necklace


2022 – Codes in Knots: Sensing Digital Memories

The artifacts consist of three-dimensional knots based on the analysis on the physical structure of Khipu knots. By using digital tools and analog methods to encrypt information, knots and knotted surfaces are created for the archiving and transmission of different forms of text such as poems or stories. Nayeli Vega’s project “Codes in Knots” revisits the ancient Andean information recording system of Khipus with modern technologies, to encode texts into series of textured, […]

Added by: Anne-Laure Fréant. Category: Passive physical visualization  Tags: quipu, knots, code


2022 – River Meandering Through Time

Zoltán Sylvester is a research scientist in the field of geology and a world-known sedimentologist, stratigrapher, and modeler. He is a co-PI of the Quantitative Clastics Laboratory (QCL) at the University of Texas at Austin in the United States. Zoltán Sylvester works especially on river meandering over time and how to precisely track how a river – that can sometimes erase its own sedimentary deposits – has moved and changed its path over time. The 3D prints Zoltán Sylvester made so far (with […]

Added by: Anne-Laure Fréant. Category: Passive physical visualization  Tags: river, sedimentology, geology, 3d printing


2023 – Light Sculptures, Matters of Impermanence

Dexter Callender III’s work captured light moving across several iconic architectures of the Boston area throughout the course of a day. He captured light using a unique setup of photography and code. Those data were then converted into layers and shapes, carved into glass and assembled to form a set of unique sculptures that won Dexter the Harold and Arlene Schnitzer Prize in the Visual Arts in 2024. The final shape represents the “immaterial” shape of light moving through […]

Added by: Anne-Laure Fréant. Category: Passive physical visualization  Tags: light sculpture, glass, photography


2024 – Dipsea Chimes: A Kinetic Data Sculpture

Dipsea Chimes is a kinetic data sculpture made by information designer Maggie Shi celebrating the Dipsea Race, America’s oldest trail race. Installed on a terrace overlooking Mt. Tamalpais - the race’s iconic setting - it is accessible to the local community. The piece aims to raise awareness of the race’s historical significance, particularly its pioneering role in equity and gender inclusion. To achieve this, the design presents race data in a tangible, interactive format, making it engaging […]

Added by: Anne-Laure Fréant. Category: Passive physical visualization  Tags: race, wood, kinetic sculpture, hand-made


2024 – Sensing Data

The Sensing Data course was held at KH-Berlin weißensee in 2024–2025. Its focus was on questioning “What happens when we can not only read information visually, but also can experience it through other senses?”. As a result of the course, 17 student projects have been realized, all being original data-physicalizations involving textile work addressing a specific research question. All 17 projects are documented on the course’s website. Source: Mark-Jan Bludau (2025) Sensing […]

Added by: Anne-Laure Fréant. Category: Passive physical visualization  Tags: textile, course, teaching, education