Tag: Pierre Dragicevic

1889 – Gaudí's Hanging Chain Models

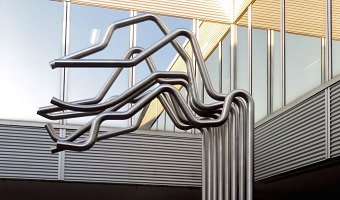
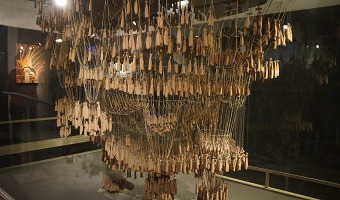
Spanish Catalan architect Antoni Gaudí disliked drawings and prefered to explore some of his designs — such as the unfinished Church of Colònia Güell and the Sagrada Família — using scale models made of chains or weighted strings. It was long known that an optimal arch follows an inverted catenary curve, i.e., an upside-down hanging chain. Gaudí's upside-down physical models took him years to build but gave him more flexibility to explore organic designs, since every adjustment would […]

Added by: Pierre Dragicevic. Category: Physical model  Tags: architecture, physical computation


1970 – MoMA Poll: Participatory Bar Chart

German-American artist Hans Haacke created a participatory physical bar chart as part of a 1970 exhibition at the Museum of Modern Art (MoMA). The audience expressed his opinion on the question "Would the fact that Governor Rockefeller has not denounced President Nixon's Indochina Policy be a reason for your not voting for him in November?". The left plexiglass box collected "Yes" answers, while the right box collected "No" answers. Rockefeller was running for re-election and was a major donor […]

Added by: Pierre Dragicevic. Category: Passive physical visualization  Tags: bar chart, participatory, politics


1987 – All the Submarines of the United States of America

This installation from American artist Chris Burden shows the 625 submarines of the US fleet from the late 1890s to the late 1980s. The cardboard models have been suspended at different heights to look like a school of fish. Sources: Found on Loren Madsen's lecture slides Art as Information – Information as Art. Wikipedia article on Chris Burden. Photo from Giorgia Valli, Grey Magazine. Related: Also see our other entries on single-datum physical visualizations.

Added by: Pierre Dragicevic. Category: Passive physical visualization  Tags: installation, single-datum, submarines, walkable


2000 – A Shape Display Appears in a Movie

An imaginary ultra high-resolution 2.5D shape display appears in the 2000 movie X-Men. The rendering and animations are visually quite appealing. Notice how impossible overhangs appear at 0:27 (the bridge) and 0:33 (the torch of the Statue of Liberty). Source: 20th Century Fox (2000) X-Men. Related: This movie scene has prompted a company to design and build an actuated solid terrain model for military customers, see our entry 2004 – XenoVision Mark III. Also see our entry 2009 – Leithinger’s […]

Added by: Pierre Dragicevic. Category: Enabling technology  Tags: cartographic, movie, pop culture, sci-fi, shape display


2005 – Molecular Jewellery

Raven Hanna got her PhD in biochemistry in 2000, and five years later, she became an artist and started to create jewelry based on molecular structures in order to communicate science through art. Image above: endorphine necklace. Sources: Raven Hanna www.madewithmolecules.com (see 2005 version) Leigh Krietsch Boerner (2010) Profile: Molecular Jewelry Design

Added by: Pierre Dragicevic. Category: Uncertain  Tags: chemistry, data jewellery, Jewelry, molecules


2008 – Psychogeographical Mapping: Travel Logging with LEGO bricks

American artist Cory Imig reconstructed the layout of the city of Savannah using LEGO bricks, and over the course of one month she added a colored brick every time she went to a particular place. Each color is a different day of the week. Source: Cory Imig (2008) Psychogeographical Mapping (see the section Documenting of her Web page for more data sculptures).

Added by: Pierre Dragicevic, sent by: Loren Madsen. Category: Passive physical visualization  Tags: data sculpture, LEGO, self-logging, temporal data, travels


2009 – Windcuts: Wind Travels Captured on Wood

Windcuts is a physical information visualisation retelling the Helsinki wind's travels over five days, using wind sensor measurements from Helsinki, and wood and a CNC machine to cut it from there too. [...] The line's direction shows the wind's direction, the line's width shows the wind's speed - a more intense wind makes a bigger line - and the line's height shows the wind's temperature. Source: Miska Knapek (2012) Windcuts.

Added by: Pierre Dragicevic, sent by: Miska Knapek. Category: Passive physical visualization  Tags: digital fabrication, Helskini, weather, wind, wooden


2013 – Programmable Matter Stars in a Movie

Programmable matter with levitation capabilities is a key visual element in the 2013 movie Man of Steel. The (slowed down) segment above reveals what appears to be a 3D node-link diagram. This display technology is employed by an advanced civilization on Krypton and is referred to as Liquid Geometry or Liquid Geo by the movie team. Visual effects supervisor Dan Lemmon explains that it consists in: a bunch of silver beads that are suspended through a magnetic field, and the machine is able to […]

Added by: Pierre Dragicevic. Category: Enabling technology  Tags: movie, network, pop culture, programmable matter, sci-fi


2013 – Punchcard Economy: Data Knitting

Punchcard Economy is a machine-knitted tapestry inspired by a 1856 banner advertising the Eight-hour day movement. The layer of visual noise shows today's departure from the eight-hour day philosophy. Working hours were collected from 116 participants, and each hour of work outside normal working hours was encoded as a color-inverted knit. A smaller version was made for the 2014 Data as Culture exhibition. Sources: Sam Meech (2013) Punchcard Economy. Explanation of the data encoding in this […]

Added by: Pierre Dragicevic, sent by: Adrian McEwen. Category: Passive physical visualization  Tags: digital fabrication, knitting, textile, working hours


2014 – District 5: Tube Charts Reveal Decline in Violence

California-based artist Loren Madsen, a long-time data sculptor (see our 1995 entry and our interview with him), created an outdoor sculpture where steel tubes show falling crime rates across eight crime categories over 30 years. The sculpture stands in front of a police station and jail in Chicago City. Sources: ​Healther Schultz (2015) California Sculptor Completes Commissioned Piece. Image courtesy of Loren Madsen. Also see Steven Pinker's TED Talk on the topic.

Added by: Pierre Dragicevic, sent by: Loren Madsen. Category: Passive physical visualization  Tags: crime, data sculpture, statistics, temporal data, situated, urban, steel