Tag: Pierre Dragicevic

1957 – Proteine Visualizations

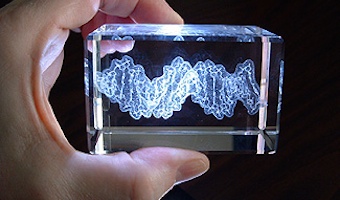
Left image: The very first physical model of a protein (myoglobin) built by crystallographer John Kendrew in 1957 using plasticine. The image is from a 1958 Nature article, for a more recent photo see here. In 1960 Kendrew completed a higher-resolution skeletal model known as the "forest of rods". The model was 2-meter wide, made of brass, and supported with 2,500 vertical rods, making it barely legible. Colored clips were attached to the rods to visualize electron density. See photos here and […]

Added by: Pierre Dragicevic. Category: Passive physical visualization  Tags: chemistry, hemoglobin, Perutz, proteine, science


2002 – Bathsheba Grossman's Crystal Engravings

Artist Bathsheba Grossman has been 3D printing mathematical surfaces as early as 1997. In 2002 she started to use subsurface laser engraving to produce 3D physical visualizations of data from astronomy, biology, and physics. Left image: a piece of DNA molecule. Right image: a 3D map of our nearby stars. The artist explains to us: This medium excels at imaging less structural data such as disconnected volumes, non-compact point clouds, and the convoluted strands of proteins. It works by […]


2004 – Cylinder: Early Sound Sculpture

Cylinder by Andy Huntington and Drew Allan may be one of the first digitally-fabricated sound sculptures. Source: http://extraversion.co.uk/2003/cylinder/ Related: Also see our entry 2007 - Explosion of sound sculptures.

Added by: Pierre Dragicevic, sent by: Fanny Chevalier. Category: Passive physical visualization  Tags: 3d printing, digital fabrication, sound, sound sculpture, temporal data


2007 – Explosion of Sound Sculptures

In 2007-2008, sound became an endless source of inspiration for data sculptors. Examples include (images from left to right): Binaural by Daniel Widrig & Shajay Bhooshan (2007) Sound/Chair by Plummer Fernandez (2008) Sound Memory by Marius Watz (2008) Reflection by Andreas Nicolas Fischer & Benjamin Maus (2008) I Will Never Change by Us by Benga (2012) Microsonic Landscapes by Juan Manuel de J. Escalante (2012) The Shape of the Sound of the Shape of the Sound by Stephen Barrass (2012) […]

Added by: Pierre Dragicevic & Yvonne Jansen, sent by: Fanny Chevalier & Benjamin Bach. Category: Passive physical visualization  Tags: art, data sculpture, sound, sound sculpture, temporal data


2008 – Activity Logging with LEGO Bricks

A visualization and logging method for personal work activity. Every tower is a day of the week. A layer is one working hour, horizontally subdivided in four quarters of an hour. Different colors are different projects. The constant availability of this interface makes it easier to log personal activity data on-the-fly, before entering it in a PIM software (an automatic method involving computer vision is being considered). Source: Michael Hunger (2008) On LEGO Powered Time-Tracking. Blog post. […]


2009 – Centograph: Dynamic Bar Charts Show Keyword Popularity

Ten actuated bar charts that show the popularity of keywords of interest in news articles over time, made by the company Tinker from London. A separate search interface is provided on a regular desktop computer and sends queries to the Google News Archive. It is permanently installed in the St Paul's School for Boys Computing Department in London. Sources: infosthetics Tinker London

Added by: Pierre Dragicevic. Category: Active physical visualization  Tags: bar charts, news, temporal data


2010 – eCLOUD & airFIELD: Ambient Airport Visualizations

Left image: eCLOUD is an airport installation at the San Jose International Airport created by Dan Goods, Nik Hafermaas, and Aaron Koblin. It is made of many large LCD pixels laid out in 3D space whose opacity change as a function of weather. Right image: A similar installation called airFIELD was created by the same team two years later. It shows air traffic and is installed at the Hartsfield-Jackson Atlanta International Airport. Sources: eCloud project (2010) airFIELD sculpture (2012) […]

Added by: Pierre Dragicevic, sent by: Fanny Chevalier. Category: Active physical visualization  Tags: air traffic, hybrid, weather


2012 – Meshu.io: Data Jewellery you can Order Online

A company lets you enter in cities you've been to and generates a physical mesh to order as a necklace, earrings, or cufflinks. Source: http://meshu.io/

Added by: Pierre Dragicevic, sent by: Moritz Stefaner. Category: Passive physical visualization  Tags: data jewellery, personal data, remote fabrication, trips


2012 – Thesis LEGO Board

A design exploration of LEGO-based physical visualizations for project management by educational scientist Daniel K. Schneider. Sources: Daniel K. Schneider (2012) Lego-compatible thesis project board. Edutech Wiki. Daniel K. Schneider (2015) Poster presentation from the EIAH'15 conference (the paper, the actual poster)

Added by: Pierre Dragicevic. Category: Passive physical visualization  Tags: LEGO, manual update, project management, rearrangeable