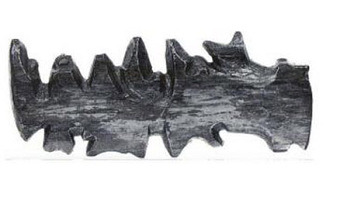
These three-dimensional maps were carved by inuits from the Ammassalik Fjord in Greenland, and used as eyes-free guides for sailing. The left one shows coastline, the right one shows a sequence of offshore islands. These inuit communities had had no direct contact with Europeans before a Danish explorer met them in 1885 and was shown the wooden maps. Sources: Bill Buxton (2007). Sketching User Experiences. page 36. Wikipedia. Ammassalik wooden maps.
1933 – IBM's Cosmograph
The left image above shows a physical flow chart (Sankey diagram) made of 1000 sheets of paper. It was not meant to be directly read, but to be photographed (see right image). The physical apparatus, called Cosmograph, allowed people without graphic skills to easily produce nice-looking Sankey diagrams. It was copyrighted by IBM in 1933 and sold for $50. Sources: Willard Cope Brinton (1939) Graphic Presentation, p. 78. Jim Strickland (2012) Cosmograph? What's a Cosmograph?
1939 – Map of Great Britain's Marine Trade
A physical World map made of copper and glass showing the size of Great Britain's merchant marine and the main trade routes as 9,000 miniature ship models. Exhibited at the New York World Fair in 1939. Sources: Willard Cope Brinton (1939) Graphic Presentation, p. 207. Life Magazine (1939) New York Opens the Gates to the World of Tomorrow. Vol. 6, No. 20, May 15 1939.
2006 – Inverted Participatory Bar Charts
Participatory physical visualization where people pick badges from tanks to vote. A lower bar means more votes. Source: Lucy Kimbell (2006). Physical Bar Charts.
2008 – Joshua Callaghan's Physical Charts
Joshua Callaghan has created various extruded 2-D charts. Source: http://www.joshuacallaghan.com/Graphs.htm
2008 – Justin Stewart's Data Sculptures
A 3-D graph and a time series visualization. Source: http://thesocietypages.org/graphicsociology/tag/r-justin-stewart/
2008 – Scientific Visualization in Crystal
Paul Bourke proposes to use sub-surface laser engraving for communicating about scientific findings at conferences. He also has seminar slides and a poster discussing the use of 3D-printed models. Source: Paul Bourke (2008) Presenting Scientific Visualisation Results as 3D Crystal Engravings.
2008 – Kids Reconstruct Harry Potter's Social Network
At the 2008 science fair (fête de la science), the Aviz group had kids build physical node-link diagrams of Harry Potter's social network using magnets and rubber bands. Source: Aviz. http://www.aviz.fr/old/fetedelascience08/
2011 – Paper Models of 3D Plots
2011 – Tōhoku Japanese Earthquake Sculpture
A data sculpture by Luke Jerram that depicts nine minutes of seismographic readings during the 9.0 earthquake. Source: Gizmodo. Photo by Luke Jerram.