Tag: Yvonne Jansen

1935 – 3D Visualizations of Power Consumption

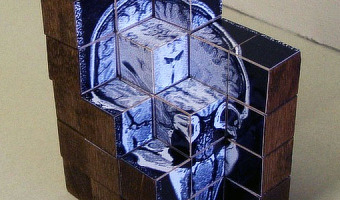
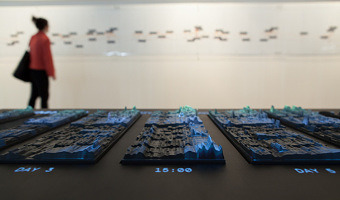
A large 3D physical visualization made by the Detroit Edison Company showing electricity consumption for the year 1935, with a slice per day and each day split into 30 min intervals. Two other examples from different Edison electricity companies are discussed in Brinton's book. These physical visualizations seem to have been used to better anticipate power demands. Sources: Willard Cope Brinton (1939) Graphic Presentation pp 354-355. Howard A. Spielman (2006) "Virtual Reality" Circa 1935. […]

Added by: Yvonne Jansen & Pierre Dragicevic, sent by: Samuel Huron. Category: Passive physical visualization  Tags: Brinton, electricity consumption, temporal data


2005 – Tactile Rubik’s Cubes

An online article compares several different designs for tactile Rubik's Cubes created between 2005 and 2010. Left image: different objects on the outside of the cube give each side a different feel. Right image: laser-cut shapes. Source: Smithsonian magazine.

Added by: Yvonne Jansen, sent by: Fanny Chevalier. Category: Other  Tags: laser-cut, rearrangeable, tactile


2008 – Rearrangeable Wooden Model of Brain Scan

A selection of MRI data glued on 60 wooden blocks which allow to physically dig into cross sections, by Neil Fraser. More details on infosthetics. Source: infosthetics.com.

Added by: Yvonne Jansen. Category: Passive physical visualization  Tags: brain, dynamic, rearrangeable, science


2008 – BMW Kinetic Sculpture

The Kinetic Sculpture is a metaphorical translation of the process of form-finding in art and design. 714 metal spheres, hanging from thin steel wires attached to individually-controlled stepper motors and covering the area of six square meters, animate a seven minute long mechatronic narrative. In the beginning, moving chaotically, then evolving to several competing forms that eventually resolve to the finished object, the kinetic sculpture creates an artistic visualisation of the process of […]

Added by: Yvonne Jansen. Category: Enabling technology  Tags: 3D, data sculpture, self-actuated, shape display, steel, kinetic sculpture


2009 – Distribution Plushies

A commercial offer for a set of 10 plush distributions. Although not formally physical visualizations, they could in principle encode actual data. Source: web shop

Added by: Yvonne Jansen, sent by: Fanny Chevalier & Jean-Daniel Fekete. Category: Physical model  Tags: Plushies, statistics


2009 – S-XL CAKE: Irregular Cake Mold

A cake mold that creates pieces of cake in different sizes. Although not a physical visualization, it could in principle encode data. Source: Ding 3000 via Infosthetics.com.

Added by: Yvonne Jansen. Category: Enabling technology  Tags: food, pie chart


2011 – David Bowen's Sea Wave Replicators

Top: Tele-present water by David Bowen is an actuated surface controlled by wires and servo-motors that replicates sea wave patterns measured in real time in a remote location. Bottom: Underwater is a larger-scale version created by the same author. Sources: David Bowen (2011) Tele-present water series. David Bowen (2012) Underwater series.

Added by: Yvonne Jansen & Pierre Dragicevic, sent by: Samuel Huron & Romain Vuillemot. Category: Physical model  Tags: sea, shape display, waves


2011 – DataCoaster: Data-Driven Toys

DataCoaster is a re-imagining of the classic waiting room toy. But instead of arbitrarily loopy lines, DataCoaster's lines are generated by data, essentially transforming a simple, kinetic toy into a graph of information. If you're interested in getting one of these for your data, have a look at the source for this entry and contact Bobby - he is planning to offer this service. Source: Bobby Genalo. DataCoaster.

Added by: Yvonne Jansen, sent by: Bobby Genalo. Category: Passive physical visualization  Tags: toy


2012 – All Possible Photons: Steel Feynman Diagrams

These are stainless steel sculptures of Feynman diagrams created by Edward Tufte. They are currently (opening Sep 12, 2012) exhibited at Edward Tufte's gallery in Chelsea. Source: Edward Tufte. All possible photons - The conceptual and cognitive art of feynman diagrams.

Added by: Yvonne Jansen. Category: Uncertain  Tags: science, steel


2012 – Emoto: Projection Augmented Heatmaps of Twitter Data

The core of the install­a­tion is a phys­ical data sculp­ture consisting of 17 objects, each repres­enting all Tweets we have collected during one day of the Olympics. Mapped onto this phys­ical sculp­ture we have then projected indi­vidual heat maps for the most inter­esting themes we have iden­ti­fied while observing emoto during the Games. Users were able to navigate through these themes using an inter­active controller and thus explore our archive. Source: Moritz Stefaner, Drew Hemment […]

Added by: Yvonne Jansen, sent by: Fanny Chevalier & Romain Vuillemot. Category: Active physical visualization  Tags: data sculpture, heatmap, online data