Tag: Active Physical Visualization

2007 – Garden of Eden

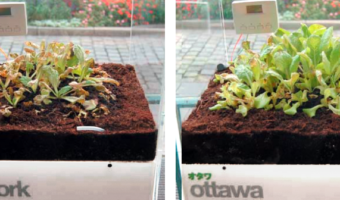
Garden of Eden consists of eight lettuces, each of which is enclosed in its own air-tight plexiglas box and represents a major city. The concencration of ozone in each box is controlled in real-time to reflect the current pollution level in the city. Sources: Thorsten Kiesl, Harald Moser, and Timm-Oliver Wilks (2007) Garden of Eden (web page) Thorsten Kiesl, Harald Moser, and Timm-Oliver Wilks (2007) Garden of Eden (paper)

Added by: Pierre Dragicevic. Category: Active physical visualization  Tags: air pollution, air quality, cities, plants


2012 – Point Cloud: A Dynamic Weather Sculpture

James Leng’s ‘Point Cloud‘ consists in a 3D wire structure materializing real-time weather information by moving and undulating. The wire structure is articulated by pistons activating wheels to deform the surface according to data. The structure could be articulated for other types of data than weather forecast. This structure represents a first attempt to build a physical 3D weather forecast system. The speed, smoothness, and direction of rotation are modulated to interpret a live feed of […]

Added by: Jean Vanderdonckt. Category: Active physical visualization  Tags: mobile surface, weather


2014 – #Good vs. #Evil

A race is going on between two Twitter hashtags, materialized by two cars. The blue car represents #Good, the red car represents #Evil. Source: Patrick Keller (2014). I&IC Workshop #3 at ECAL: output > “Botcaves” / Networked Data Objects.

Added by: Pierre Dragicevic. Category: Active physical visualization  Tags: cars, robots, toys, tweets


2014 – x.pose: a Wearable Dynamic Data Sculpture

x.pose is a dynamic wearable data sculpture that makes the collection of the wearer's location data visible in real-time in the physical world. From the project webpage: x.pose is a wearable data-driven sculpture that exposes a person's skin as a real-time reflection of the data that the wearer is producing. In the physical realm we can deliberately control which portions our bodies are exposed to the world by covering it with clothing. In the digital realm, we have much less control of what […]


2014 – Drip-By-Tweet: Each Vote is a Drop

Team of developers Domestic Data Streamers created a real-time physical visualization of votes for a graphic design contest. A person can vote for a specific piece by sending a tweet, after which the machine releases a drop of yellow liquid and sends it to the corresponding test tube. Source: Domestic Data Streamers.

Added by: Pierre Dragicevic. Category: Active physical visualization  Tags: liquid, participatory, streaming, tweets, votes


2015 – Passim: Visual Reconceptualisation of Spatial Theories

The master thesis of Paul Heinicker, Passim, visually reflects the humanistic discourse about space. The research of spatial theory led to four major notions how to think space from a sociopolitical perspective. The installation explores the relationship of these four spatial notions by projecting visualisations of geopolitical data from the Heidelberg Institute for International Conflict Research onto the physical sculpture. Eventually, different world-views are created, that show how notions […]


2015 – Physical Weather Display

Japanese Software engineer Ken Kawamoto invented the Tempescope, a device that displays weather forecasts or current weather physically. The Tempescope physically simulates weather forecasts via a wireless connection from a computer or a smartphone in real-time in order to get a better idea of what the actual weather is outside. Raining is simulated by water dripping down the box, temperature is represented by color-chaning LEDs and cloudiness is conveyed by a mist diffuser. Source: Dovas […]

Added by: Pierre Dragicevic & Jean Vanderdonckt, sent by: Lora Oehlberg. Category: Active physical visualization  Tags: weather


2016 – Actuated Prism Map of Italy

This actuated prism map was created by Alessandro Masserdotti in the OpenDot Fablab in Milan, Italy, for the SOD16 meeting and invites people explicitly to Touch That Data. OpenDot Fablab (Milan) project with Arduino and 3D printing visualizes regional statistics changing the height of each region. In the picture there's the building count from the regional extracts. Sources: Open streetmap wiki, 2016. Video from a demo at OSMIT 2016.

Added by: Yvonne Jansen, sent by: Jason Dykes. Category: Active physical visualization  Tags: 3d printing, cartographic, digital fabrication, prism map


2016 – FizViz: A Wall-Mounted Data Gauge

Maker project by iot design shop of a clock-like physical visualization device. "The concept is that you'd hang a set of FizViz widgets in your office, workshop, or wherever you want to watch and share data that matters" Source: FizViz - Large Scale Physical Visualizations for your Stats! (video)

Added by: Aurélien Tabard, sent by: Romain Vuillemot. Category: Active physical visualization  Tags: ambient display, clock, gauge


2016 – Podium: Physical Competition Monitor

Podium is an internet connected device that uses real-time social data to show comparative rankings of a brand’s performance versus their competitors. Developed in a partnership between iSketchLab and TrackMaven, Podium is a physical device that pulls Facebook, Instagram, and Twitter data from airline brands and offers an snapshot overview of the brands' performance on social media. Sources: Podium

Added by: Aurélien Tabard. Category: Active physical visualization  Tags: business, social media