Tag: Active Physical Visualization

2007 – Wable: Web Behavior Shown with a Dynamic Bar Chart

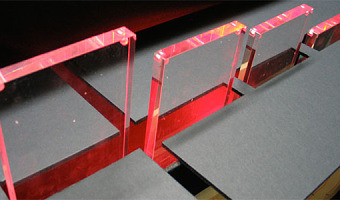
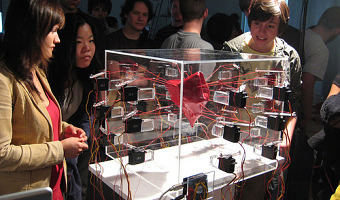
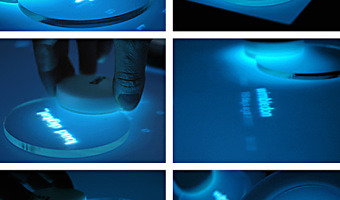
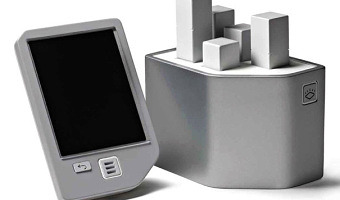
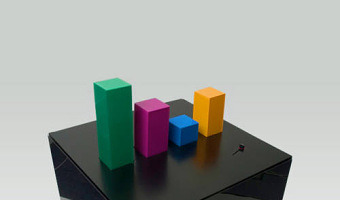
A dynamic bar chart visualizing one's online activity. From the company's website: The personal feeds from webapplications like Plazes, Flickr, and Last.fm tell much about the activity of an individual on the internet. In this project we aim to explore how you can visualize the changes of your web identity over time and create a physical link between your virtual and real identity. The interface consists of both a physical table and a web application. This direct feedback from your web identity […]


2009 – Centograph: Dynamic Bar Charts Show Keyword Popularity

Ten actuated bar charts that show the popularity of keywords of interest in news articles over time, made by the company Tinker from London. A separate search interface is provided on a regular desktop computer and sends queries to the Google News Archive. It is permanently installed in the St Paul's School for Boys Computing Department in London. Sources: infosthetics Tinker London

Added by: Pierre Dragicevic. Category: Active physical visualization  Tags: bar charts, news, temporal data


2009 – DataMorphose: Animated Sails

DataMorphose is an interactive installation which projects various data streams into real space and visualizes it three-dimensionally. Information is represented by spanned and moving sails directly in the room. Source: Christiane Keller (2009). Data Morphose.

Added by: Samuel Huron. Category: Active physical visualization  Tags: self-actuated, statistical data


2009 – Poly: Physical Bar Chart Showing Online Poll Data

Poly, a self-actuated bar chart which shows replies to online polls. Sources: Digit, London. Original polling website is down [Oct 2014]; check out an archived version instead.

Added by: Pierre Dragicevic. Category: Active physical visualization  Tags: data sculpture, online poll, self-actuated


2009 – Pulse: Animated Heart Shows Sentiments

pulse is a live-visualization of recent emotional expressions, written on private weblog communities like blogger.com. Weblog entries are compared to a list of emotions, which refers to Robert Plutchik’s seminal book Psychoevolutionary Theory of Emotion published in 1980. Plutchik describes eight basic human emotions in his book: joy, trust, fear, surprise, sadness, disgust, anger, and anticipation. He developed a diagram in which these eight emotions, together with their weakened and amplified […]

Added by: Samuel Huron. Category: Active physical visualization  Tags: emotional responses, self-actuated


2009 – Virtual Gravity: Giving Physical Weight to Data

Virtual gravity is an interface between digital and analog world. With the aid of analog carriers, virtual terms can be taken up and transported from a loading screen to an analog scale. The importance and popularity of these terms (data base: Google Insights for Search), outputted as a virtual weight, can be weighed physically and compared. Therefore impalpable, digital data get an actual physical existence and become a sensually tangible experience. Source: Silke Hilsing (2010) via fubiz

Added by: Samuel Huron. Category: Active physical visualization  Tags: data sculpture, online data


2010 – Dynamic Bar Chart to Visualize One's Finances

A design project by Swedish designer Hampus Edström to help people keeping an overview of their financial situation. Sources: Hampus Edström, project presentation. Yanko Design blog.


2012 – Emoto: Projection Augmented Heatmaps of Twitter Data

The core of the install­a­tion is a phys­ical data sculp­ture consisting of 17 objects, each repres­enting all Tweets we have collected during one day of the Olympics. Mapped onto this phys­ical sculp­ture we have then projected indi­vidual heat maps for the most inter­esting themes we have iden­ti­fied while observing emoto during the Games. Users were able to navigate through these themes using an inter­active controller and thus explore our archive. Source: Moritz Stefaner, Drew Hemment […]

Added by: Yvonne Jansen, sent by: Fanny Chevalier & Romain Vuillemot. Category: Active physical visualization  Tags: data sculpture, heatmap, online data