Tag: Enabling Technology

1900 – Modern Solid Terrain Modeling

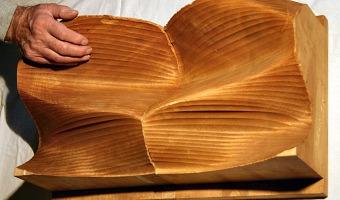
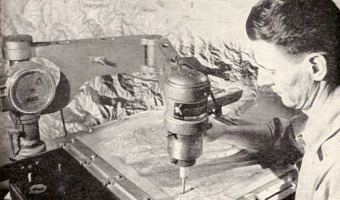
The Institute of Cartography ETH Zurich published a great review of past and present techniques for doing solid terrain modeling. Although terrain models are not physical visualizations in the strict sense, the techniques could be in principle used to convey data. Physical terrain models were already being built in 16th the century, and the review covers modern techniques from the early 20th century to today's digital fabrication. Source: Institute of Cartography ETH Zurich (2006) Terrain […]

Added by: Pierre Dragicevic. Category: Enabling technology  Tags: cartographic, cartography, terrain model, terrain modeling


1968 – Charles Csuri's Numeric Milling Sculpture

Csuri's wooden sculpture Numeric Milling is one of the few early computer sculptures created with a computer-driven milling machine... This work made use of the Bessel function to generate the surface. The computer program then generated a punched tape to represent the coordinate data. Included were instructions to a 3-axis, continuous path, numerically controlled milling machine. Sources: Csuri Project: Plotter Drawing, 1966 - 1970: Numeric Milling Photo of Numeric Milling Sculpture courtesy […]


2000 – Graph Boards

Mathematics and geometry are often taught to blind students using a cork board with raised grid lines, push pins and rubber bands. The right image shows a teacher explaining the use of the Graphic Aid for Mathematics, a physical kit sold by the American Printing House for the Blind. Date of invention unknown. Sources: Suzan Osterhaus (2001) Teaching Math to Visually Impaired Students. Youtube video series explaining the traditional cork board: APH Graph Board with Susan Osterhaus. McGookin et […]

Added by: Pierre Dragicevic. Category: Enabling technology  Tags: blind, pin board


2004 – XenoVision Mark III: A Dynamic Solid Terrain Model

The XenoVision Mark III Dynamic Sand Table by the company Xenotran is a self-reconfigurable solid terrain model with military applications. There is little information on this device but it seems well ahead of its time. Michael Schmitz and coauthors explain how this high-resolution shape display with 7000 actuators was originally inspired by a scene from the X-Men movie (see our entry 2000 – A Shape Display Appears in a Movie). Sources: Directions Magazine (2004) Interview with Xenotran […]

Added by: Pierre Dragicevic. Category: Enabling technology  Tags: cartographic, military, movie, solid terrain model


2008 – BMW Kinetic Sculpture

The Kinetic Sculpture is a metaphorical translation of the process of form-finding in art and design. 714 metal spheres, hanging from thin steel wires attached to individually-controlled stepper motors and covering the area of six square meters, animate a seven minute long mechatronic narrative. In the beginning, moving chaotically, then evolving to several competing forms that eventually resolve to the finished object, the kinetic sculpture creates an artistic visualisation of the process of […]

Added by: Yvonne Jansen. Category: Enabling technology  Tags: 3D, data sculpture, self-actuated, shape display, steel, kinetic sculpture


2010 – Shanghai Spheres

For the 2010 World Expo at Shanghai, Japanese firms ADK and Murayama and Las-Vegas firm Fisher Technical Services, Inc. created an array of 1,008 15cm diameter actuated spheres, each suspended by its own micro winch. The show does not include data visualizations. Kinetic sculptures made of arrays of suspended spheres abound. An early one is Joe Gilbertson's (2007). More recent ones include Kinetic Rain (2012) and Triptych (2014). Also check 2008 – BMW Kinetic Sculpture on this list. Source: […]

Added by: Pierre Dragicevic. Category: Enabling technology  Tags: large-scale, self-actuated, shape display, kinetic sculpture


2010 – Headspace: Array of Actuated Bars

Artist Geoffrey Drake-Brockman created Headspace, a matrix of 256 motorized bars (total size 150 x 150 x 80cm) to display the faces of over 700 schoolchildren. Not a data visualization, but could be used as such. Source: Geoffrey Drake-Brockman (2010). http://www.drake-brockman.com.au/

Added by: Pierre Dragicevic. Category: Enabling technology  Tags: shape display


2012 – Large-Scale Drone Swarm

Floating spheres again, but this time there is no wire. An outdoor demonstration of 49 quadrocopters in a synchronized motion, by Ars Electronica Futurelab and Ascending Technologies GmbH. Sources: The Blaze (2012) Also watch another demonstration involving 20 small quadrocopters indoors by the GRASP Lab at the University of Pennsylvania (2012).

Added by: Pierre Dragicevic. Category: Enabling technology  Tags: drones, quadrocopters


2013 – Quickly Authoring Physical Visualizations

Rahul Bhargava animates workshops where he has participants quickly build physical visualizations using raw material. One of the workshop's goals is to develop people's visual literacy. Source: Rahul Bhargava (2013) Activities for Building Visual Literacy. datatherapy.wordpress.com.

Added by: Pierre Dragicevic. Category: Enabling technology  Tags: authoring, visual literacy


2030 – Digitally-Fabricated Visualizations of the Future

These images have nothing to do with physical visualizations: they are not data-driven but abstract, and they are not even physical but instead photo-realistic computer-generated images. However, these images from digital artist Lee Griggs give an idea of what physical visualizations may look like in the near future once we overcome the limitations of today's digital fabrication technology: they will be visually and haptically elaborate, colorful, rich, and beautiful. Make sure you look at the […]

Added by: Pierre Dragicevic, sent by: Benjamin Bach. Category: Enabling technology  Tags: future