Tag: Passive Physical Visualization

1915 – Wire Models of Factory Worker Movements

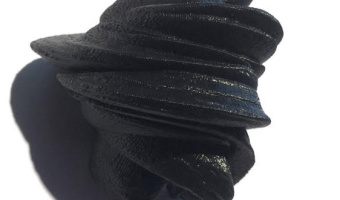
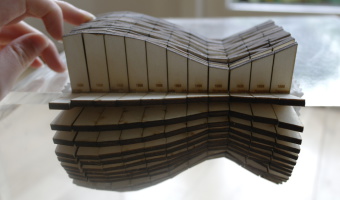
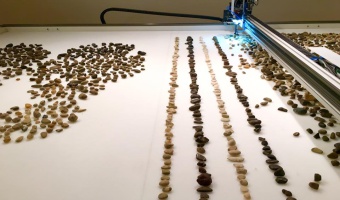
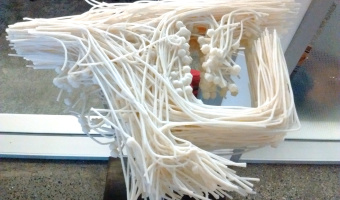
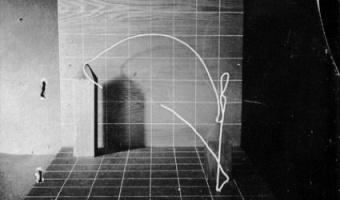
3D wire models of hand motion paths (or chronocyclegraphs) created by Frank Gilbreth, a pioneer in the study of motion in the workplace. In his 1917 book, Gilbreth explains how he created these solid models from time-lapse photographs, and how useful they are to study and teach human motion. Left image: Wire model of foreman on drill press. This shows “positioning” in the midst of “transporting.” Right image: First photograph of wire models showing one man's progress of learning paths of least […]

Added by: Pierre Dragicevic. Category: Passive physical visualization  Tags: factory, hand movement, pragmatic, temporal data, wire


2013 – Releases

The New-York-based design agency HUSH crafted a piece of custom software that generates digital, three dimensional visual forms based on the unique timbres and tonalities of individual voices. They asked 100 people to share their feelings about the end of 2013, and the beginning of 2014, in the form of a spoken “release.” Using the forms generated by their software they then created and analog printed a limited run of 100 posters (right image) that they sent to the people that inspired them […]

Added by: David Schwarz. Category: Passive physical visualization  Tags: 3d printing, sound, sound sculpture, voice


2014 – Lego Senate

Built by Lance Ulanoff, this Lego representation tells the story of the 2014 US midterms. Red and blue Lego blocks represent the number of Democrat and Republican senate seats. The representation was updated over the evening of the election, as seats went to either Democratic or Republican candidates. Captions tell the story, indicating the time of seat wins and the names of senators. Source: Mashable, The Lego Senate: How the 2014 midterms played out, brick by brick

Added by: Jennifer Payne & Samuel Huron. Category: Passive physical visualization  Tags: LEGO, politics, stop motion animation, storytelling


2014 – Rearrangeable Display of Ice Data

This 3d data visualization, created by Johannes Jacubasch and Judith Weda, shows sea ice levels from 1979 to 2012. The years are plotted on one axis and the months on the other axis, while the height of the wooden pieces shows the level of sea ice. This data visualization can be opened up at any year or month to view the data from up close. If you break the Y-axis it shows all the data from a particular year. If the X-axis is broken it shows ice levels of a particular month over all the years. […]


2014 – Sound Bites

Sound Bites is the result of an experimental design practice. Four days of 24/7 ambient sound recordings resulted in 128 4-second intimate sound loops. Fast Fourier Transform frequency analysis and geometrical operations transformed time, frequency, and amplitude into X, Y and Z dimensions, forming 3D sonic shapes. These ‘disco donuts’ were 3D printed into 128 sound objects. Vacuum molded they formed the base to cast 128 unique chocolate objects. New rhythmic patterns were created, comprising […]


2015 – Jller: A Robot Rearranges Pebbles by Geologic Age

Jller is a machine created by German artist Benjamin Maus and Czech artist Prokop Bartoníček that sorts pebbles from the German river Jller by their geologic age. To do this, Jller first analyzes an image of the stone it selects, extracting information like dominant color, color composition, lines, layers, patterns, grain, and surface texture. The machine then places the stones in alignment of age and type by sucking them into an industrial vacuum gripper and dropping them in the correct […]

Added by: Pierre Dragicevic, sent by: Alice Thudt. Category: Passive physical visualization  Tags: age, geology, pebbles, rearrangement, robot


2015 – Inequalities Quipu

This project is about the revival of the ancient Incan Quipu. This project is about a comparison of well-being in Latin America and top leading countries in Scandinavia as assessed by the OECD Better Life Index. It shows the inequalities between those two cultures as well as between men and women visualised with the help of the Incan recording devise - the quipu. Source: Ewa Tuteja, http://tuteja.info/inequalities-quipu/

Added by: Ewa Tuteja. Category: Passive physical visualization  Tags: hand-made, quipu, knots


2015 – U.S. Cost of Political Campaigns

The New York Times has used stacks of Monopoly plastic hotels to explain what the cost of the U.S. political campains means in terms of households. Though closer to concrete scales than it is to data visualization (that usually presents data in a more structured manner), this representation made of physical pieces from the famous board game makes the message particularly compelling. According to the New York Times, Just 158 families have provided nearly half of the early money for efforts to […]

Added by: Fanny Chevalier. Category: Passive physical visualization  Tags: concrete scale, finances, LEGO, Monopoly, politics


2016 – Motus Forma: People's Motions in a Shared Space

Motus Forma is a data sculpture by Brian Allen and Stephanie Smith that aggregates 10 hours of people movements in the lobby space at Pier 9. The 1300+ motion paths are piled up according to time. Sources: Autodesk (2016) Motus Forma Instructables (2016) Motus Forma Photo by Pierre Dragicevic Related: Also see our other entries on temporal data.

Added by: Pierre Dragicevic. Category: Passive physical visualization  Tags: 3d printing, data sculpture, temporal data


2016 – Central Park NYC Temperatures

Seasonal plot of the monthly average temperature in Central Park NYC since 1869. The long axis is mapped to years, the other axis is mapped to months from January to December. Data sourced from the National Weather Service. Source: RoundTableRdDesign on shapeways.

Added by: Kris Dawsey. Category: Passive physical visualization  Tags: digital fabrication, temperatures, weather