Tag: Passive Physical Visualization

1980 – People on a Giant World Map

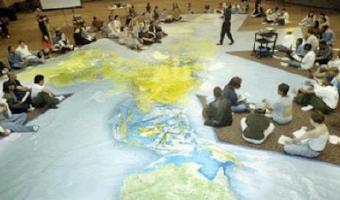
The World Game Workshop used a giant (basketball court size) world map to display population growth, distribution, and density, energy use, food and a host of other global variables and problems. 100 people were placed on the map, located where humanity is currently in the world, each one representing 1% of the global population. They were then placed in charge of their region and given the responsibility of solving the world’s problems. Sources: Post by Medard Gabel, Executive Director, […]


2005 – Email Erosion: First Data Sculpture?

Although there are older data sculptures (see our entry 1995 – Loren Madsen’s Early Data Sculptures), this installation from artist Ethan Ham may have been the first artifact to be called a data sculpture. In 2005, Andrew Vande Moere, a Design Professor and author of the now discontinued data visualization blog infosthetics, described the installation as: an art installation that automatically creates physical data sculptures, using spam & e-mail as data to trigger the sculpting […]

Added by: Pierre Dragicevic. Category: Passive physical visualization  Tags: data sculpture, emails, spam, styrofoam, water


2015 – Spheres of Risk

These shiny porcelain spheres visualize how risky a person is. The project was created by Nikita Rokotyan and the team during the 72U creative residency program in 2015 led by Maria Scileppi. Thirty-eight guest speakers were asked to complete a survey consisting of 12 questions related to 3 different types of risk: financial, social and physical. Their answers were analyzed and mapped onto a sphere to visualize a person’s willingness to take certain risks. The individual spheres were then […]

Added by: Nikita Rokotyan. Category: Passive physical visualization  Tags: data sculpture, porcelain, survey data


2016 – Duo Tornado Vase

This work by the chinese designer Yisha Cai explores meteorological phenomena using digital data, conception and production tools. Especially interested in data visualization, Yisha Cai collected rain data through sensors and an arduino device. The data were then processed to generate a 3D model. The cylindrical clay tornado form was generated by code in a digital platform. It was subsequently printed in porcelain by a 3D ceramics printer. The accompanying glass globe form was shaped as a […]


2019 – Physical Globe Model of Global Temperature Change

Using open source NASA GISS data, british model maker and designer Matthew Stewart created a sculpture which communicates the temperature rise of the globe compared to 50 years ago. With the data’s lat/long variable, Matthew Stewart represented temperature increase with length of protruding rod – the greater the difference, the longer the rod. Made of 3,204 pieces, assembly had to be perfect to ensure the lattice structure held its form correctly, & so the data was represented accurately. […]

Added by: Anne-Laure Fréant. Category: Passive physical visualization  Tags: global warming, cartographic, globe, NASA, data sculpture


2021 – The Flood Necklace

The “Flood Necklaces” embeds flood history data of the river Loire in the city of Orleans. Each ball of clay is sized according to the water heights measured on flood scales between 1800 and 2003, in the city of Orleans. Data is from the Region Centre-Val-de-Loire (DREAL), for floods between 1804 and 2003. The biggest flood recorded happened in 1866, and impacted most rivers and regions of France. It was such a major event that a report to the Emperor has been written to estimate the damages […]

Added by: Anne-Laure Fréant. Category: Passive physical visualization  Tags: data jewellery, flood, Loire river, ceramics, necklace


2021 – Phylogenetic Tree with Real Plants

There’s a fantastic plant phylogenetic tree display at the Geneva Botanical Garden with live examples growing at the tips of the evolutionary branches. This display was part of an exhibition open from 20 May 2021 to 17 October 2021. Sources: Quote and photo: tweet by Marko Kaksonen Conservatoire et Jardin botaniques de Genève (2021) Le grand bazar de l’évolution – Grande exposition sur l’évolution de la vie sur terre (archived version). Related: Also see our similar entry 2018 – […]

Added by: Pierre Dragicevic, sent by: Maarten Lambrechts. Category: Passive physical visualization  Tags: rearrangement, plants, phylogenetic, tree


2022 – River Meandering Through Time

Zoltán Sylvester is a research scientist in the field of geology and a world-known sedimentologist, stratigrapher, and modeler. He is a co-PI of the Quantitative Clastics Laboratory (QCL) at the University of Texas at Austin in the United States. Zoltán Sylvester works especially on river meandering over time and how to precisely track how a river – that can sometimes erase its own sedimentary deposits – has moved and changed its path over time. The 3D prints Zoltán Sylvester made so far (with […]

Added by: Anne-Laure Fréant. Category: Passive physical visualization  Tags: river, sedimentology, geology, 3d printing


2023 – Weave: 3D Parallel Coordinates

Weave is a project that aim to raise the awareness of invisible barriers faced by immigrants navigating Dutch public systems through data physicalization. People can pick a thread corresponding to their country of origin, and thread individual responses to each question. Upon finishing, they can wear the special glasses that unveil a deeper meaning of each question. The project employs metaphors to help interpret the discursive artifact. The more challenging options are placed higher to […]

Added by: Kuangyi Xing. Category: Passive physical visualization  Tags: migration, participatory, parallel coordinates


2023 – Carbon Scales

Carbon Scales is a low-tech data physicalisation of carbon emissions acribed to different phases of food production - agriculture, processing, packaging, and transport. People use Carbon Bits (i.e., 80-100g blocks made from wood, screws, bolts, and a binding agent) to touch and make sense of carbon emissions and place these bits on each platform of Carbon Scales to try and guess the emissions it takes to make and transport a specific food product. Source: Lindrup, M. V. A., Menon, A. R., & […]