Tag: Passive Physical Visualization

1939 – Map of Great Britain's Marine Trade

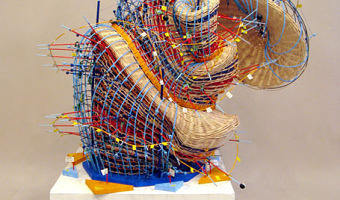
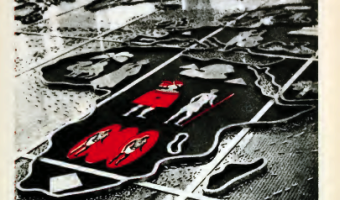
A physical World map made of copper and glass showing the size of Great Britain's merchant marine and the main trade routes as 9,000 miniature ship models. Exhibited at the New York World Fair in 1939. Sources: Willard Cope Brinton (1939) Graphic Presentation, p. 207. Life Magazine (1939) New York Opens the Gates to the World of Tomorrow. Vol. 6, No. 20, May 15 1939.

Added by: Pierre Dragicevic. Category: Passive physical visualization  Tags: Brinton, cartographic, cartography


2006 – Nathalie Miebach's Woven Sculptures

Artist Nathalie Miebach created a range of beautiful woven sculptures out of weather data. Source: Nathalie Miebach. http://www.nathaliemiebach.com/weather.html (see TED Talk).

Added by: Pierre Dragicevic, sent by: Fanny Chevalier. Category: Passive physical visualization  Tags: artistic, data sculpture, hand-made, weather


2008 – Andreas Fischers' Data Sculptures

Andreas Nicolas Fischer is a Berlin-based artist. Above are four of his 3-D data sculptures: Fundament (world GDP and derivatives volume) Indizes (finance data over time) A week in the life (cellphone communications) Reflection (FFT of a music piece). Source: http://anfischer.com via infosthetics.


2008 – Scientific Visualization in Crystal

Paul Bourke proposes to use sub-surface laser engraving for communicating about scientific findings at conferences. He also has seminar slides and a poster discussing the use of 3D-printed models. Source: Paul Bourke (2008) Presenting Scientific Visualisation Results as 3D Crystal Engravings.

Added by: Pierre Dragicevic, sent by: Yvonne Jansen. Category: Passive physical visualization  Tags: digital fabrication, science, subsurface laser engraving


2008 – Kids Reconstruct Harry Potter's Social Network

At the 2008 science fair (fête de la science), the Aviz group had kids build physical node-link diagrams of Harry Potter's social network using magnets and rubber bands. Source: Aviz. http://www.aviz.fr/old/fetedelascience08/

Added by: Pierre Dragicevic. Category: Passive physical visualization  Tags: education, hand-built, network, participatory, rearrangeable


2010 – Relational Ornaments: Networks Shown with Textile

Textile art based on the network maps of Valdis Krebs. Gundega Strautmane, a Latvian textile artist and designer, visualizes social and physical networks in a show called Relational Ornaments. The networks are created using various sized pins to depict nodes and threads connecting them to show relationships. Bringing visualization into the tactile world lends it a weight not able to be achieved on a computer screen. It allows the viewer to pause, spend time with the information, feel it, sense […]

Added by: Jean-Daniel Fekete, sent by: Fanny Chevalier. Category: Passive physical visualization  Tags: network data, textile