Tag: Passive Physical Visualization

1941 – Traffic Flow Profiles of the Interregional Highway System

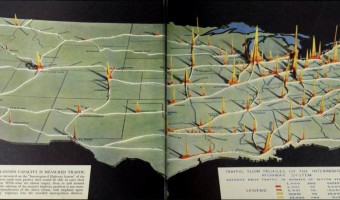
2D area diagrams encoding average daily traffic as height and color are set up along their respective highways on a background map of the US. Background map seems to be a cut-out wooden panel; area diagrams potentially cardboard, or also wood veneer. Source: In: Fortune, June 194, pp. 94-95. Original by-line reads "Map by PRA. Photograph by Richard Carver Wood". PRA is presumably the Public Roads Administration (cf. https://en.wikipedia.org/wiki/Federal_Highway_Administration#History). Accessed […]

Added by: Till Nagel. Category: Passive physical visualization  Tags: cardboard, cartograpic, map, paper, roads, traffic


2011 – Digital Arab Spring

Twitter-networks were used by the citizens of the North African states to communicate and organize during the Arab Spring. The virtuality of a computer network becomes tactile and palpable here, like the virtual organization led to actual protests in the streets. The purpose of this data visualisation is to illustrate a magazine-cover and spread and was created as part of an academic graphic design programme. Sources: René Rieger, Digital Arab Spring. Gestalten Blackboard entry (2012).

Added by: René Rieger. Category: Passive physical visualization  Tags: citizen infrastructures, network, textile, twitter


2014 – 3D Interest Rate Surface

3D print of a yield curve surface with change in material to create grid lines; on matching laser cut box with light inside. Left axis is time (2006-2010), right axis is "term structure", i.e. interest rates for 1 month out to 120 months; height at any given point is the interest rate on that day for that time period. Data is from Bank of Canada, visualization and print is is by Richard Brath at Uncharted Software. Source: Richard Brath, 3D Canadian Yield Curve Surface 2006-2010 for 1 to 120 […]

Added by: Richard Brath. Category: Passive physical visualization  Tags: 3d printing, finance, surface, yield curve surface


2016 – Accomplishments

Accomplishments is an exploration of personal data tracking, wearable art, wearable technology, social media, and data physicalization. Each day accomplishments were tracked, first on paper then by sewing spheroid masses onto a dress worn for four months. By hand sewing each accomplishment onto this dress, they became a part of the wearer's physical presence and identity. The work juxtaposes the immediateness of social media posts, and the separate identity we create for ourselves online which […]

Added by: Michelle Sylvestre. Category: Passive physical visualization  Tags: data clothing, textile


2017 – Participatory Matrix and Parallel Coordinates

In order to inform a local audience about a largely-avoided topic such as cancer, a research study was commissioned by KnowAndBe.Live, a startup working in the field of cancer prevention awareness, with the aim of fostering a bottom-up information request from a local audience. The research team included a designer, a sociologist and experts on the topic of cancer-prevention, who worked together relying on a collaborative design approach, with the goal of delineating possible strategies to […]

Added by: Matteo Moretti. Category: Passive physical visualization  Tags: cancer, participatory


2018 – Traveling Datavis Game

A public participation project, in which the boundaries of the political debate were discussed. Hoping to define a respectable “clean” political discourse and formulate a treaty reflecting the public's expectations of what constitutes a legitimate discourse based on political ideology or clear up when is a misuse of a public position. The project was made up of an ice-cream truck, driving around Israel periphery, inviting the public to participate in 4 interactive games asking question about […]

Added by: Roni Levit. Category: Passive physical visualization  Tags: participatory, politics


2019 – Tattoo Biosensors

Tattoos that Change Color When Reacting With Glucose Levels: minimally invasive, injectable dermal biosensors were developed for measuring pH, glucose, and albumin concentrations. Sources: Biotech (2019) Twitter post. Yetisen et al (2019) Dermal Tattoo Biosensors for Colorimetric Metabolite Detection.

Added by: Pierre Dragicevic, sent by: Maarten Lambrechts. Category: Passive physical visualization  Tags: indexical, medical, skin, tattoo


2019 – Sleep Blanket

A visualization of my son's sleep pattern from birth to his first birthday. Crochet border surrounding a double knit body. Each row represents a single day. Each stitch represents 6 minutes of time spent awake or asleep. Source: Seung Lee (2019) Twitter thread. Related: Also see our entry 2013 – Temperature Scarves and Afghans.

Added by: Pierre Dragicevic, sent by: Steffen (@s1effen). Category: Passive physical visualization  Tags: baby, data clothing, textile, self-logging, sleep


2019 – Hostile Terrain 94: Deaths at the US/Mexico Border

Prototype of a series of physical maps that will be exhibited across 94 cities worldwide in fall 2020. Each of the 3500 hand-written toe tags represents the recovered body of a migrant who died while crossing the US/Mexico border in the Sonoran Desert between 2000 and 2020. Coordinated by the Undocumented Migration Project (UMP). To learn more about UMP and the context of this map, listen to the Radiolab podcast series Border Trilogy. Sources: hostileterrain94.wordpress.com Left image from […]

Added by: Pierre Dragicevic, sent by: Luiz Augusto de Macêdo Morais. Category: Passive physical visualization  Tags: cartographic, deaths, migration, toe tag


2019 – New Worry Beads: Deaths from Terrorism

Worry Beads, one for every year from 1945 (closest in the pic), are scaled at one cc per human life. The volume of each is set by the number of terrorist-caused deaths for that year globally. The whole thing is about 40' long, the largest bead (2014) is 19" dia. There’s other material which hopefully makes clear that the #1 American fear, terrorist attack, is ridiculous. There’s another string of beads, 50" long, which shows terrorist deaths in the US. You’re more likely to be […]

Added by: Pierre Dragicevic, sent by: Loren Madsen. Category: Passive physical visualization  Tags: beads, deaths, terrorism