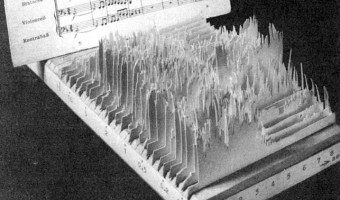
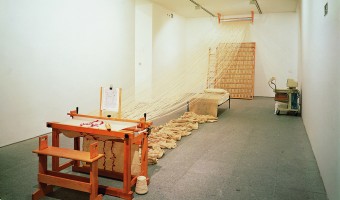
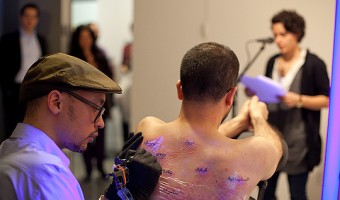
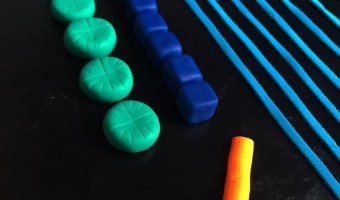
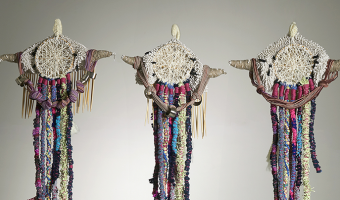
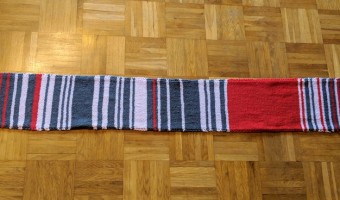
Tag: Passive Physical Visualization

1951 – Electricity Generated or Demanded

A 3D chart made out of a jagged cardboard for each year representing generated electricity and demand over time. Three-dimensional chart used by Central Electricity Generating Board planners, c.1954. Consists of about 300 cards with square-cut stepped edges in an enclosure of chrome steel uprights, mounted on a wooden base, with a handle at each end. Data represented from October 1951 to April 1954. An early example of 3D data visualisation [...] Sources: Alice Cliff and Jenny Rinkinen (2018) […]

Added by: Till Nagel, sent by: Jill Hubley. Category: Passive physical visualization  Tags: 3D, cardboard, electricity, power, temporal data


1960 – 3D Spectrogram

The object on the left may be one of the first sound sculptures. It appears in a 1960 book by German acoustician and musicologist Fritz Winckel (click on the middle image to see the full page). It is a physical 3D spectrogram showing a frequency analysis of an 8-second recording of Beethoven's Eighth Symphony. The left axis is frequency, the bottom/right axis is time, and the vertical axis is the strength of a particular frequency at a particular time. The figure caption uses the term […]

Added by: Pierre Dragicevic, sent by: Jill Hubley. Category: Passive physical visualization  Tags: music, science, sound, sound sculpture, spectrogram


2010 – and Counting... Tattoo of War Casualties

Wafaa Bilal’s brother, Haji, was killed by a missile at a checkpoint in their hometown of Kufa, Iraq in 2004. Bilal feels the pain of both American and Iraqi families who have lost loved ones in the war, but the deaths of Iraqis like his brother are largely invisible to the American public. and Counting… addresses this double standard as Bilal turns his own body — in a 24-hour live performance — into a canvas, his back tattooed with a borderless map of Iraq covered with one dot for each Iraqi […]

Added by: Aarati Akkapeddi. Category: Passive physical visualization  Tags: body, cartographic, deaths, interactive, performance, tattoo, war


2013 – Pop-Up Infographics

In 2013, Italian graphic designer Elena Turtas crafted four books that convey data about sustainability using pop-up and movable paper mechanisms. Source: Elena Turtas (2014) The Four Books of Visualising Sustainability.


2016 – Thoughtforms: 3D-Printed Thoughts

Kellyann Geurts and In Dae Hwang, Monash University, give physical shape to thoughts by turning EEG data into solid objects. During three public events at Melbourne in 2016, she placed a mobile EEG device on volunteers and asked them to think of a memory or emotion of their choice. Their EEG output was translated in real time into a 3D shape they could see on a computer screen. Participants could then press a button to pause the shape and send it to a 3D printer. They were then invited to write […]

Added by: Pierre Dragicevic, sent by: Benjamin Bach. Category: Passive physical visualization  Tags: 3d printing, digital fabrication, EEG, thoughts


2017 – Gravity Wave Spectrogram - LIGO

Humanity has been gazing at light from distant stars since time immemorial. But in 2015, our ability to understand the University achieved a major milestone, when ripples in Spacetime itself - instead of light - told the tale of an ancient, cataclysmic collision between black holes. The Laser Interferometer Gravitational-Wave Observatory (LIGO) is an experimental system of almost unbelievable sensitivity. Using interferometer arms four kilometers long, it can detect changes in length as tiny as […]

Added by: Louis R. Nemzer. Category: Passive physical visualization  Tags: astronomy, Gravity Waves, physics, science


2018 – DayDohViz: Data Visualizations made with Play-Doh

DayDohViz is as a "daily" inspiration project that experiments with physically visualizing data in 3D using a smartphone and Play-Doh. Yes, Play-Doh. Creator Amy Cesal's subjects range from self-disclosing and serious (her personal financial data, government enforcement actions) to delicious and exhilarating (pizza types, top roller coasters). Amy has found the tactile, ephemeral & imprecise nature of Play-Doh - so different from the typical data viz technology - to be creatively […]

Added by: Amy Cesal. Category: Passive physical visualization  Tags: clay, hand-made, play-doh


2018 – Anthropocene Footprints

Handmade physicalizations of Canada's greenhouse gas emissions, by Mieka West and Sheelagh Carpendale. Each object represents data from a specific year (1990, 2010, and projections to 2030). Initially meant to be smog masks, the designs evolved into strange and beautiful objects evoking indigeneous artefacts such as Native American dreamcatchers, Inca quipus and Polynesian genealogical instruments, and whose visual and material complexity is reminiscent of Nathalie Miebach’s Woven Sculptures. […]

Added by: Pierre Dragicevic. Category: Passive physical visualization  Tags: textile, greenhouse gas, hand-made, pollution, quipu


2018 – Phylogenetic Tree with Real Specimens

As part of a zoology class, evolutionary biologist Leo Smith created a phylogenetic tree of fishes where each leaf is an actual fish specimen. Source: Leo Smith's tweet (29 April 2018). Related: Also see our other entries on physical visualizations built by re-arranging physical items.

Added by: Pierre Dragicevic, sent by: Mark Simpson. Category: Passive physical visualization  Tags: biology, rearrangement, tree


2018 – Inequality in Chile Represented with LEGO Bricks

Inequality in Chile represented with LEGO bricks. Made by Harry Lizama, a data scientist in the Ministry of the Environment of Chile. The surface represents the totality of the income. Each person represents a decile. In light green is decile 10. In green is decile 9. In dark green are deciles 7 and 8. In red are deciles 1 to 6. Sources: Harry Lizama, based on data from the Ministry of Social Development, CASEN 2017. Image taken from […]

Added by: Harry Lizama. Category: Passive physical visualization  Tags: Chile, income, inequality, LEGO