Tag: Passive Physical Visualization

2012 – What made me

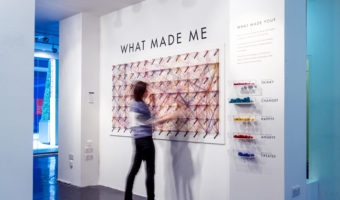
An interactive public installation where visitors could engage by picking coloured strings corresponding to feelings, inspirations, thoughts or influences that make the person they are today, and link these strings to words on the wall to make a path visualizing associated concepts tied to each of these feelings, inspirations, thoughts and influences. WHAT MADE ME was designed by Dorota Grabkowska and Kuba Kolec for the Birmingham Made Me Design Expo (15-22 June 2012) at the Mailbox, […]

Added by: Fanny Chevalier. Category: Passive physical visualization  Tags: emotion, graph, participatory, parallel coordinates


2015 – Life in Clay: Sharing Memories through Data Pottery

Alice Thudt, a PhD student in Computational Media Design, crafts pieces of pottery that embody data about moments she shared with her loved ones. Left image (2015): cereal bowls showing Skype-call history between Alice and her parents. On the front bowl, each line represents a day where they skyped. On the other bowl, each dot represents 10 min of call time. She offered a bowl as a present to her parents and kept the other one as a reminder to stay in touch every time she has breakfast. Middle […]


2015 – U.S. Unemployment Rate 1948-2015

Visual journalist Jon Keegan created this quick chart using U.S. unemployment rate starting from January 1948 (the first year that the U.S. started to record the number) through the end October 2015. The long axis represents years from 1948-2015, and each column is made of of 12 chips, each representing one month's unemployment rate figure. The height of each chip represents the rate for that month. One can see a dramatic cliff start to rise up in the fall of 2008, as the global economic […]


2015 – Summer in the City

The visualization explores the direct influence of weather and traffic volume on air pollution, comparing data of a 4-week period during summer 2015 in Lugano (Switzerland). Different colored laser cut plates fixed on wires represent daily data. As the wires are diagonally mounted on the structure, looking from different sides, they evidence either daily data or the evolution of the parameters. Source: Carola Bartsch (2015), Summer in the city


2015 – Dataseeds: Flying Data

The dataseeds are a translation of data on ‘falls on and from stairs and steps, aged 50-89’. The data drives the surface area of the wing of the dataseed, which dictates the spin and falling speed of the data-object©. Source: Nick Dulake and Ian Gwilt (2015) Dataseeds - flying data

Added by: Pierre Dragicevic, sent by: Ian Gwilt. Category: Passive physical visualization  Tags: injury, kinetic sculpture, plants, seeds


2016 – Cairn: Situated Data Collection and Analysis for Fab Labs

Designed within the community of practice of a French FabLab, Cairn aims at understanding the variety of practices within FabLabs. Cairn explores tangible alternatives to questionnaires and other traditional evaluation techniques, and stresses aesthetic and affective dimensions to create an engaging experience. It invites Fablab visitors to reflect on their practices by materializing their activities using small colored woodentiles. Interacting individually with Cairn, people contribute to […]

Added by: Pauline Gourlet. Category: Passive physical visualization  Tags: collecting tool, fab lab, participatory, rearrangeable


2017 – Coral Reefs

This data sculpture made by three design students at the datafossil #3 workshop depicts the destruction of Australian coral reef since 1985 (in orange) together with the rise of ocean temperature (in gray). The Great Barrier Reef has been losing more and more of its area since the last 27 years. One of the biggest cause is coral bleaching due to global warming and more exactly to the rise of the temperature of ocean's water. Scientists say that the reef is going to keep deteriorate as fast […]

Added by: Alizée Parry & Pierre Dragicevic. Category: Passive physical visualization  Tags: coral, datafossil, global warming, sea, water, weather


2017 – Wearable Self

Wearable Self is a collection of data jewelry which is Jiyeon Kang's master's thesis project at Parsons School of Design. South Korean designer Jiyeon Kang transformed a year of self-tracking data (e.g. daily steps) gathered by Fitbit and iPhone Health into personalized fashion items that can hold and wear. Through laser cut and 3d printing with different materials, the designer creates customizable fashion items generated by users' self-data, aiming to make self-tracking data more meaningful […]


2017 – EuroGums: Edible Population Pyramids

Eurogums are edible population pyramids of the 28 EU member countries. Whereas 27 countries taste cherry-sweet, the UK Eurogum is rather sour, due to the referendum and Brexit. Source: meikl3D Related: Also see our other entries on data-driven food.

Added by: Michael Stanka. Category: Passive physical visualization  Tags: age pyramid, brexit, data cuisine, europe, population, food


2017 – Hand-Crafted Magazine Infographics

Infographic designers at the National Geographic crafted a 3D physical visualization out of paper and colored cardboard in order to prepare a 2D infographic. Source: Alberto Lucas López (2017) Handmade #dataviz (tweet). Related: Also see our entry on IBM's cosmograph.

Added by: Aurélien Tabard & Pierre Dragicevic. Category: Passive physical visualization  Tags: animation, hand-made, infographic, paper