List of Physical Visualizations
and Related Artifacts
Physical Model

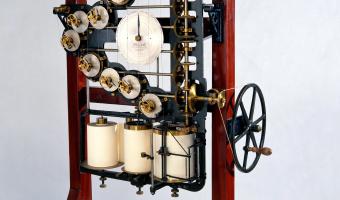
1876 – Kelvin's tide predictor

In 1876-1878, Baron Lord Kelvin builds his harmonic analyzer and tide predictor machines. The harmonic analyzer broke down complex harmonic, or repeating, waves into the simpler waves that made them up. The tide predictor machine could calculate the time and height of the ebb and flood tides for any day of the year. Sources: Luigi M Bianchi (2003) Lecture 20: Analog vs Digital. Photo from Allison Marsh (2024) https://spectrum.ieee.org/tide-predictions.

Added by: Pierre Dragicevic. Category: Physical model  Tags: sea, tides, water


1893 – Galton Board

The galton board (named after and invented by Sir Francis Galton) is a physical device consisting of a vertical board with rows of interleaved pegs. The board illustrates the central limit theorem, by showing that beads dropped onto the pegs in the middle at the top end up in bins at the bottom approximately following a normal distribution, with most beads staying close to the middle. Sources: Wikipedia Article on the Galton Board. Photo by Matemateca (IME/USP)/Rodrigo Tetsuo Argenton, CC-BY-SA […]

Added by: Benjamin Schneider. Category: Physical model  Tags: statistics, randomness


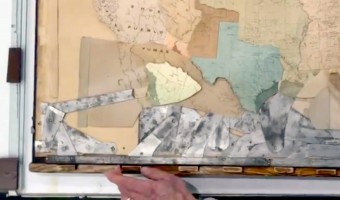
1896 – James Ive's Mechanical Teaching Map

The boundaries of the United States transformed during the 19th century, often through violent means. Mapmaker James Ives created this mechanical map to help people, especially students, visualize these changes. Sources: Leventhal Map Center (2019) Tweet. Boston Rare Maps (2016) Fantastic mechanical map of United States territorial expansion. Video by the Leventhal Map Center.

Added by: Pierre Dragicevic, sent by: Jason Forrest. Category: Physical model  Tags: cartographic, mechanical interaction


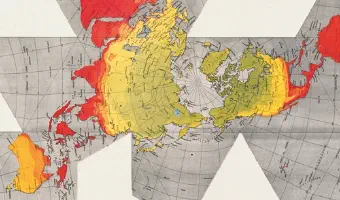
1943 – Dymaxion Map & Folding Globe

“Also know as the “Dymaxion Map,” the Fuller Projection Map is the only flat map of the entire surface of the Earth which reveals our planet as one island in one ocean, without any visually obvious distortion of the relative shapes and sizes of the land areas, and without splitting any continents. It was developed by R. Buckminster Fuller. All flat world map representations of the spherical globe contain some amount of distortion either in shape, area, distance or direction […]

Added by: Alex Hughes. Category: Physical model  Tags: Cartographic, Globe, Dymaxion, Buckminster Fuller


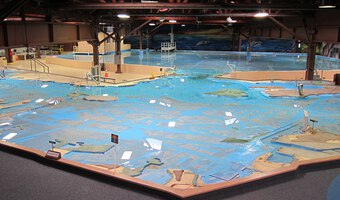
1957 – US Army Corps of Engineers San Francisco Bay Model

A working hydrodynamic model of San Francisco Bay and the surrounding waterways, with tides. It is still open to the public as a demonstration, although it is no longer used for research. <em>Source:</em> Wikipedia <a href="https://en.wikipedia.org/wiki/U.S._Army_Corps_of_Engineers_Bay_Model">U.S. Army Corps of Engineers Bay Model</a>. Related: Also see our related entry 1949 – Mississippi River Basin Model.


1979 – Planetenweg Uetliberg: The Solar System as a Hiking Path

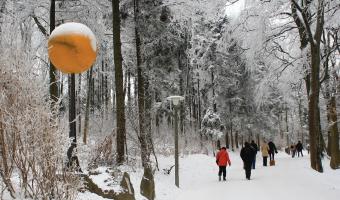
“Planetenweg Uetliberg” is a 2h hiking path near Zurich in Switzerland. It enables people to experience the sizes and distances between the different main bodies in our solar system. The hike starts at the sun (image above). Following the path, a hiker visits the different main bodies at a scale of 1 : 1 billion (see overview included above), that is, 1 meter on the path corresponds to 1 million kilometers in space. The sun has a diameter of 1.39m. Venus has the size of a pinhead in […]

Added by: Yvonne Jansen, sent by: Jason Dykes. Category: Physical model  Tags: solar system, walkable


1984 – Dewdney's Analog Gadgets

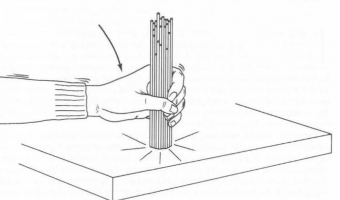
Alexander Dewdney is a Canadian mathematician and computer scientist who authored the recreational mathematics column in the Scientific American magazine from 1984 to 1991, after Martin Gardner and Douglas Hofstadter. In 1984, he describes a number of imaginary analog computers he calls "Analog Gadgets", which can in principle solve computing problems instantly. The first one, shown on the left image, uses spaghetti to sort numbers. The second one uses strings to find the shortest path in a […]

Added by: Pierre Dragicevic, sent by: Michael McGuffin. Category: Physical model  Tags: physical computation


1999 – Jonathan Chertok's Reproductions of Mathematical Plaster Models

Since 1999, independent researcher and architect Jonathan Chertok has been digitally reconstructing and 3D-printing historical plaster models from 19th-century mathematical model collections, originally hand-crafted in the 1860s and cataloged in early 20th-century German sources. His work focuses in particular on the Klein-Schilling collection, many of whose originals are housed in European institutions such as the University of Göttingen and the Institut Henri Poincaré in Paris. Chertok’s “1.0 […]

Added by: Pierre Dragicevic, sent by: Jonathan Chertok. Category: Physical model  Tags: mathematics, education, mathematical functions, plaster


2013 – Sonic Sculptures

Sonic Sculptures is a project by Blair Neal for visualizing the FFT data of songs and generating 3D printable files. A custom piece of software takes in real-time audio and generates shapes (spirals/loops/flat planes) that can be exported as files that can be 3D printed as a keepsake that captures the low/mid/high range of sound. Meant to be a physical artifact of someone’s favorite song. Source: Blair Neal (2015) Sonic Sculptures. (archived version) Related: Also see our other entries on […]

Added by: Blair Neal. Category: Physical model  Tags: sound sculpture, sound, 3d printing


2020 – Regression with a Cardboard, Straw and Strings

In November 2020, a public health expert named Jorge Pacheco Jara found he could explain regression with a cardboard, a straw, and strings. He posted a video of his idea on Twitter (video above), implying that his device performs a classic linear regression, but in reality it is closer to a Deming regression — for an illustration of the difference, see this image (but also, his device minimizes the total distance to the regression line and not the sum of the square distances). Presumably […]

Added by: Pierre Dragicevic, sent by: Olga Iarygina. Category: Physical model  Tags: physical computation, education, regression, math, statistics