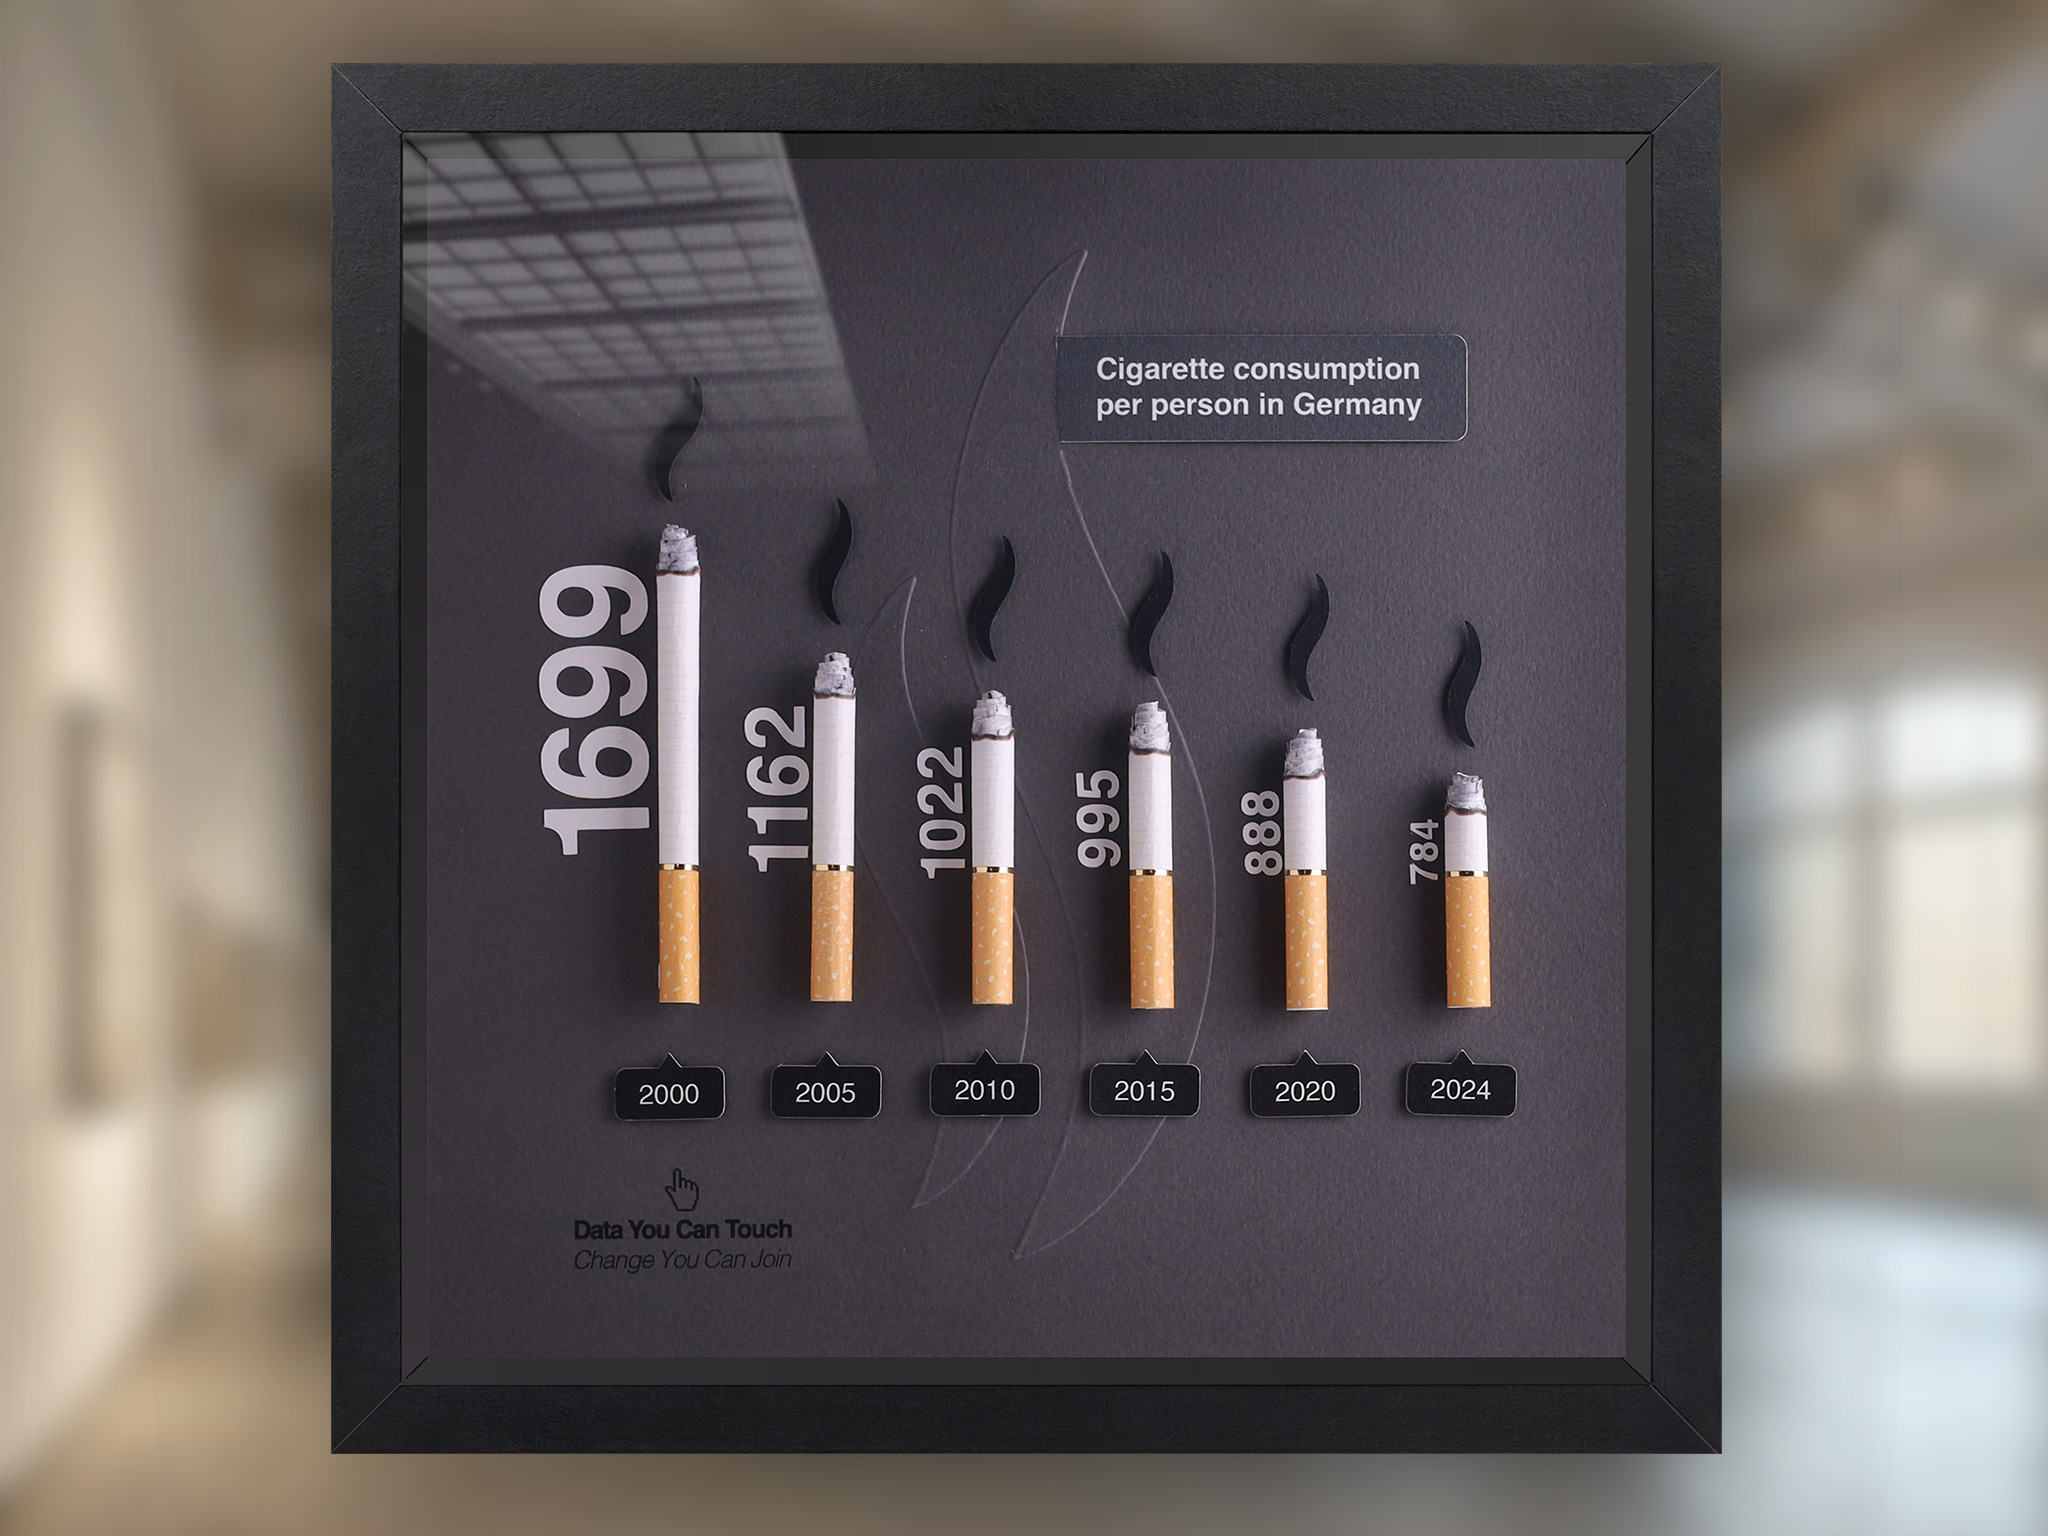
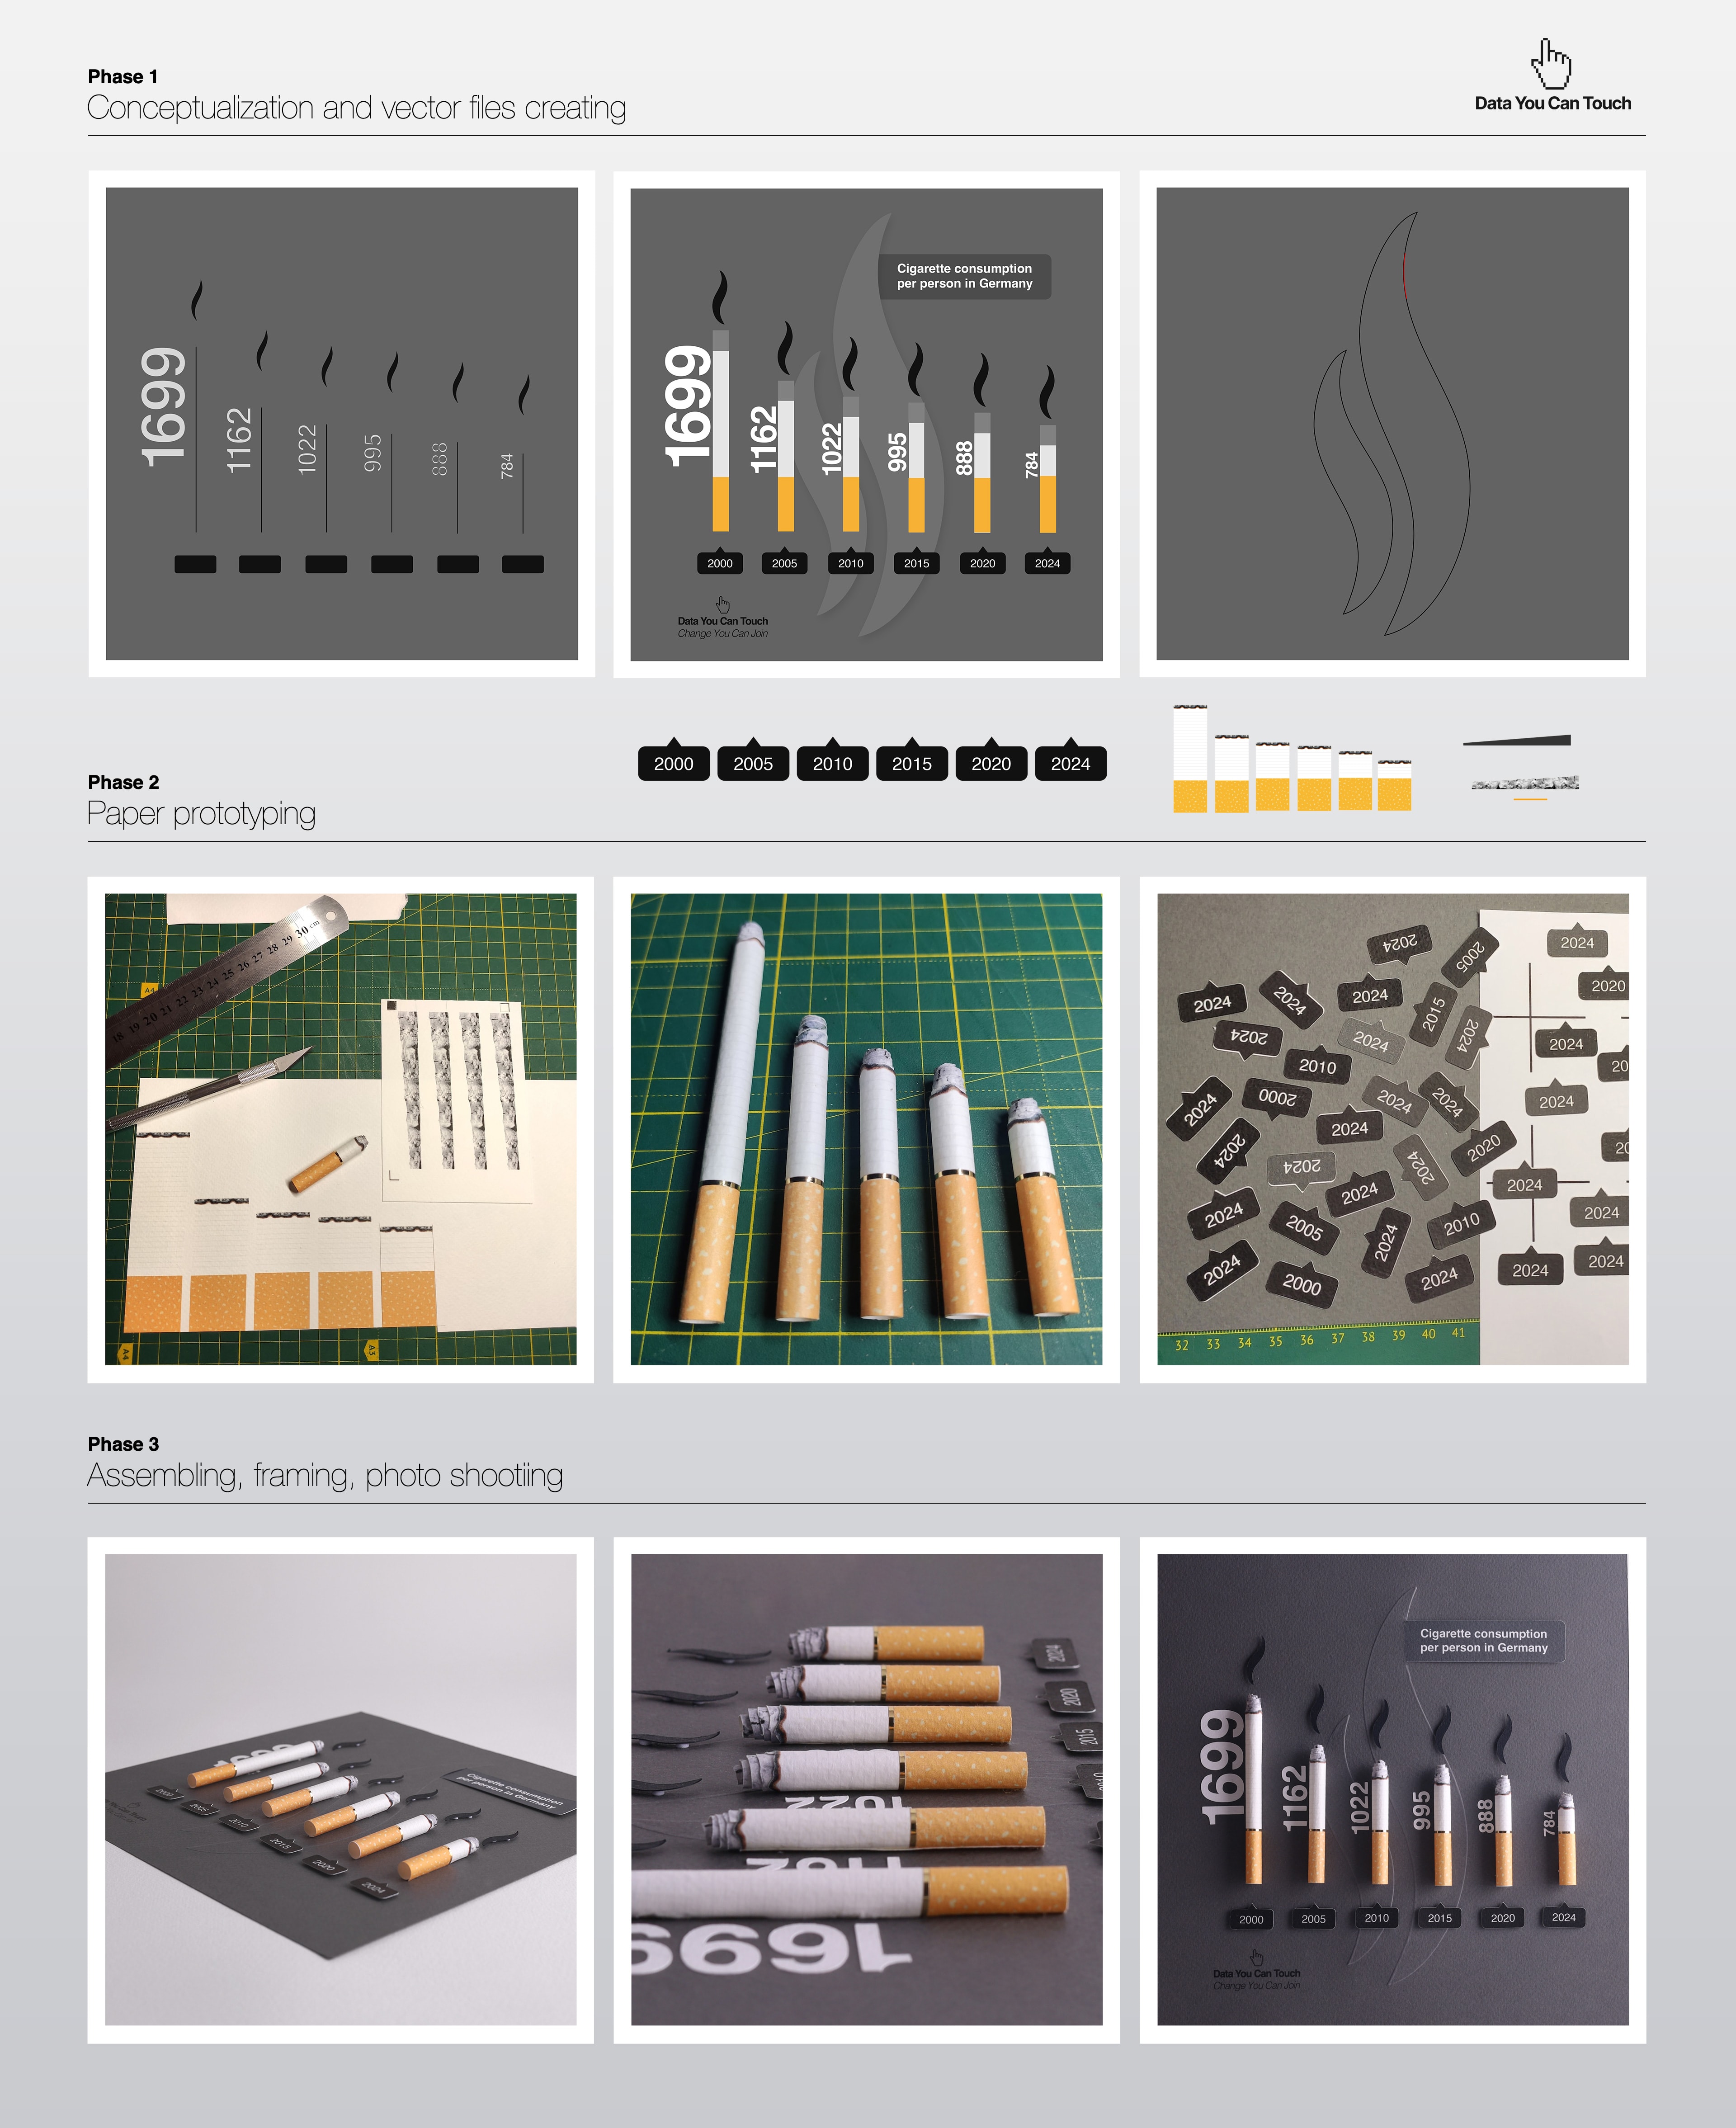
After coming across several reports about declining smoking rates in Germany, I started thinking about how to make this shift more visible beyond charts and numbers. Data on a screen can feel impersonal, so I built a straightforward paper visualization to give the trend a more physical presence.
Transforming statistics into something you can actually see and imagine helps make the progress clearer. Perhaps this visual approach will encourage more people to move toward a smoke-free lifestyle.
Source: Roman Kopolovets (2025) Cigarette consumption per person in Germany.
Related: Also see 2017 – Are you Sure you Want to Smoke?
Added by: Roman Kopolovets.
Category:
Passive physical visualization
Tags:
cigarette consumption, Germany, handmade, paper, physical data visualization