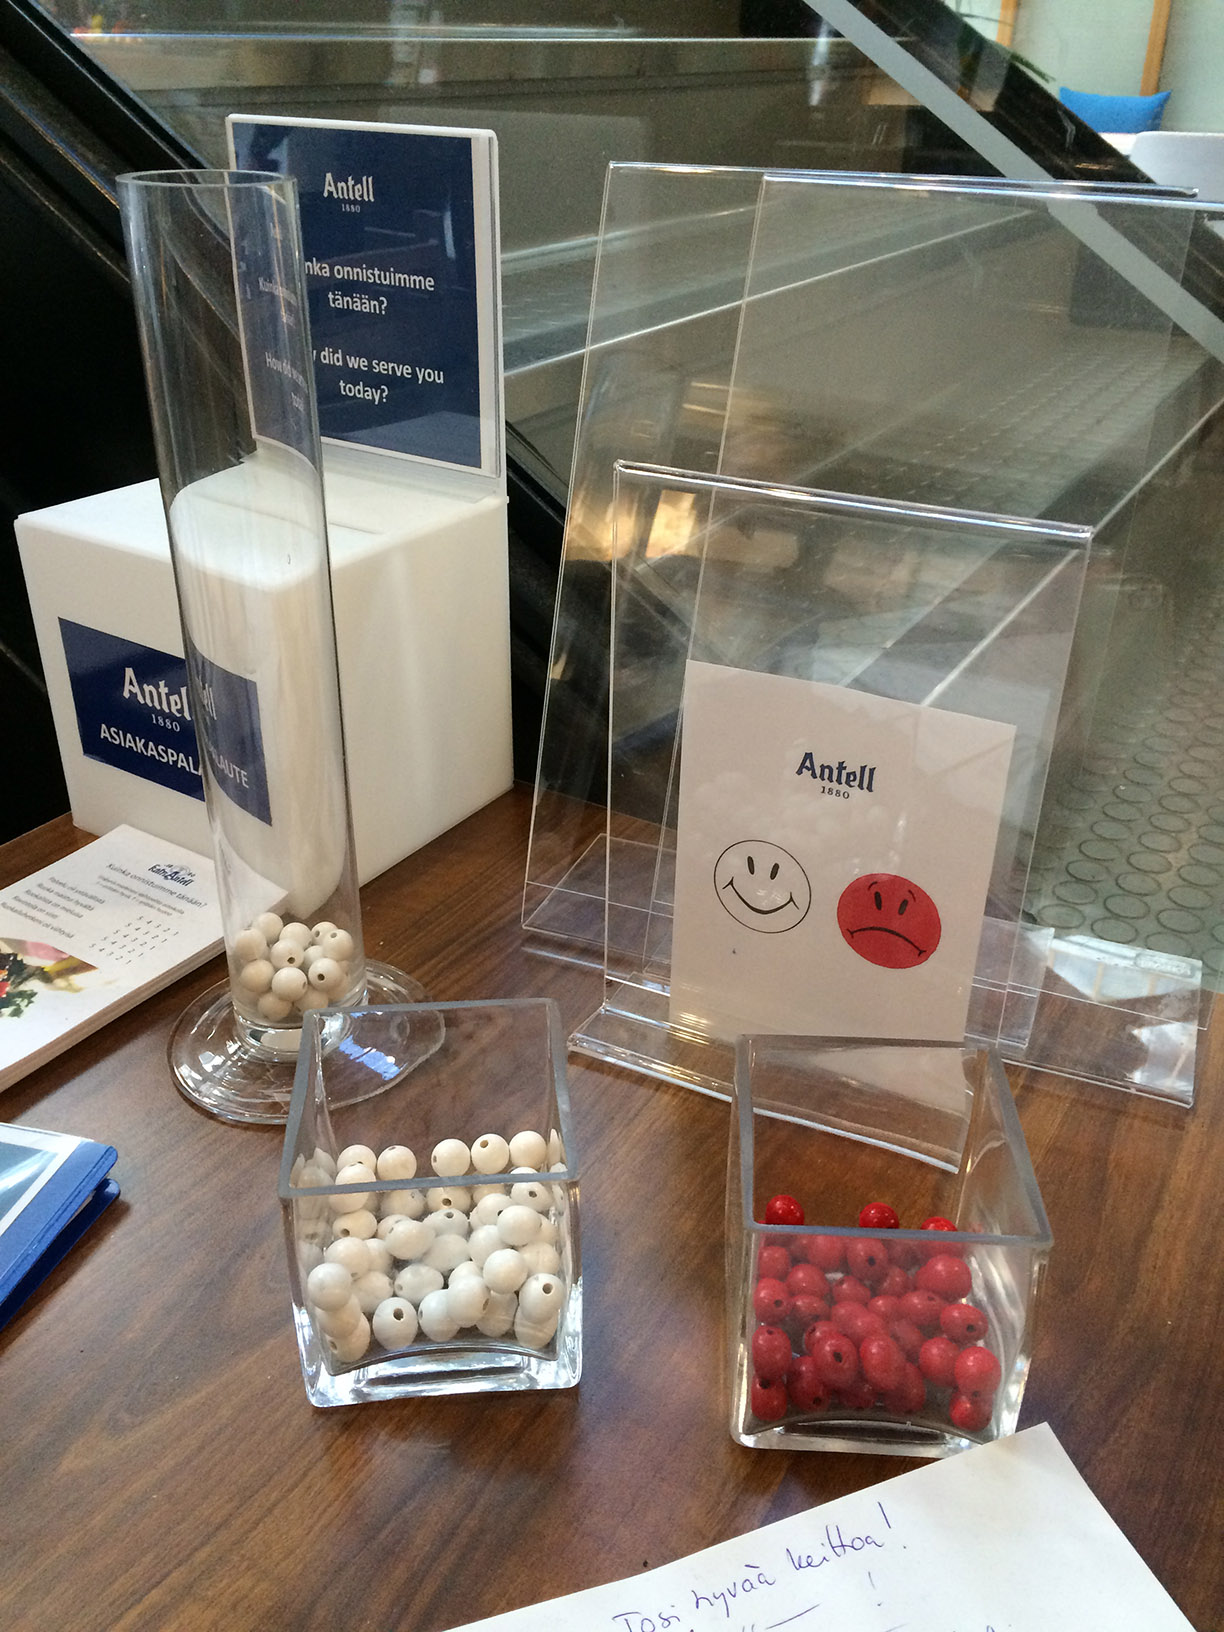
Participatory physical bar charts at the exit of the Antell cafeteria at the University of Helsinki. White beads represent statisfied customers, red beads are unsatisfied ones.
Source: Antell. Photo by Luana Micallef.
Related: Also see similar contraptions by Hans Haacke (1970), Lucy Kimbell (2006), and Jennifer Payne (2014).
Added by: Pierre Dragicevic.
Category:
Passive physical visualization
Tags:
bar chart, customer satisfaction, participatory