Tag: Fanny Chevalier

2005 – Tactile Rubik’s Cubes

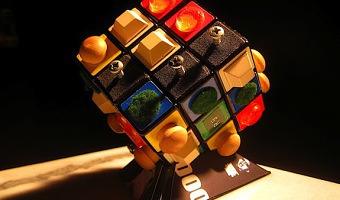
An online article compares several different designs for tactile Rubik's Cubes created between 2005 and 2010. Left image: different objects on the outside of the cube give each side a different feel. Right image: laser-cut shapes. Source: Smithsonian magazine.

Added by: Yvonne Jansen, sent by: Fanny Chevalier. Category: Other  Tags: laser-cut, rearrangeable, tactile


2006 – Nathalie Miebach's Woven Sculptures

Artist Nathalie Miebach created a range of beautiful woven sculptures out of weather data. Source: Nathalie Miebach. http://www.nathaliemiebach.com/weather.html (see TED Talk).

Added by: Pierre Dragicevic, sent by: Fanny Chevalier. Category: Passive physical visualization  Tags: artistic, data sculpture, hand-made, weather


2009 – In-Formed: More Data-Driven Tableware

Another data-driven tableware, this time conveying world statistics. The fork on the image shows calories consumption for the US and three other countries. Source: Nadeem Haidary.

Added by: Yvonne Jansen, sent by: Fanny Chevalier. Category: Passive physical visualization  Tags: data sculpture, tableware, world statistics


2010 – Relational Ornaments: Networks Shown with Textile

Textile art based on the network maps of Valdis Krebs. Gundega Strautmane, a Latvian textile artist and designer, visualizes social and physical networks in a show called Relational Ornaments. The networks are created using various sized pins to depict nodes and threads connecting them to show relationships. Bringing visualization into the tactile world lends it a weight not able to be achieved on a computer screen. It allows the viewer to pause, spend time with the information, feel it, sense […]

Added by: Jean-Daniel Fekete, sent by: Fanny Chevalier. Category: Passive physical visualization  Tags: network data, textile


2012 – General Motors' 3D LEGO Visualizations

LEGOs help business executives log and explore data. Sources: Mark Wilson (2012) How GM Is Saving Cash Using Legos As A Data Viz Tool. The Daily Drive (2012) GM Plays with Legos (Video).

Added by: Pierre Dragicevic, sent by: Fanny Chevalier. Category: Passive physical visualization  Tags: industry, interactive, LEGO, manual update, pragmatic visualization, rearrangeable