Woven Chronicle is a cartographic wall drawing that, in the artist’s words, represents “the global flows and movements of travelers, migrants, and labor.” Kallat uses electrical wires—some of which are twisted to resemble barbed wire—to create the lines, which are based on her meticulous research of transnational flows. Wire is an evocative and contradictory material: it operates as both a conduit of electricity, used to connect people across vast distances, and as a weaponized obstacle, such […]
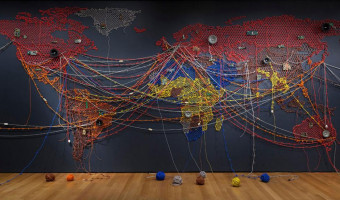
Woven Chronicle is a cartographic wall drawing that, in the artist’s words, represents “the global flows and movements of travelers, migrants, and labor.” Kallat uses electrical wires—some of which are twisted to resemble barbed wire—to create the lines, which are based on her meticulous research of transnational flows. Wire is an evocative and contradictory material: it operates as both a conduit of electricity, used to connect people across vast distances, and as a weaponized obstacle, such as the fences used to erect borders and encircle refugee camps. Kallat’s family was splintered by the Partition of India in 1947 upon independence from Britain, which divided the country geographically along religious lines and induced the movement of more than ten million people in one of the largest forced migrations in human history. Woven Chronicle speaks to this personal memory—and collective history—in its material presence, merging the artist’s research on migration with metaphors of violence, and accompanied by an ambient soundscape that evokes the steady hum of global movement. Source: Reena Saini Kallat (India, b. 1973), Woven Chronicle, 2011–19