PlanetWalker is a public physicalization displayed in an open workplace, using a mosaic art style to present the walking activity of 16 co-located users over four weeks. The mosaic patterns were pre-designed based on the eight planets (Mercury, Venus, Earth, Mars, Jupiter, Saturn, Uranus, and Neptune), symbolizing exploration and representing individual users. It encouraged participants to walk 7,500 steps per day. This daily goal was divided into ten small goals, each represented by a colored […]
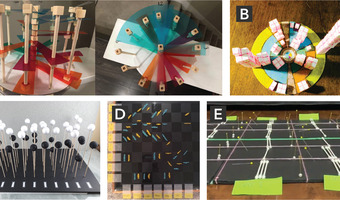
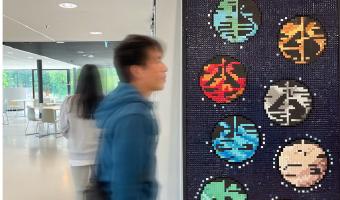
PlanetWalker is a public physicalization displayed in an open workplace, using a mosaic art style to present the walking activity of 16 co-located users over four weeks. The mosaic patterns were pre-designed based on the eight planets (Mercury, Venus, Earth, Mars, Jupiter, Saturn, Uranus, and Neptune), symbolizing exploration and representing individual users. It encouraged participants to walk 7,500 steps per day. This daily goal was divided into ten small goals, each represented by a colored tile. Each user was assigned half of a planet consisting of 200 unfilled tiles. Unmet goals remained as unfilled tiles. As users met their daily goals, colored mosaic tiles appeared, gradually revealing the full form of the planet, like the footprints left by astronauts while exploring the moon. This metaphor was used to inspire users to embark on their journey toward physical activity.
Source: Mengyan Guo, Qianhui Wei, Xingjian Zeng, Lorenzo James, Pieter Van Gorp, Steven Vos, Steven Houben, Jun Hu, “Having it physical is a different story”: Physicalizing personal data publicly to motivate physical activity, International Journal of Human-Computer Studies, Volume 203,2025,103552,ISSN 1071-5819,
Related: Also see our entry 2013 – SweatAtoms: Physical Activity Sculptures