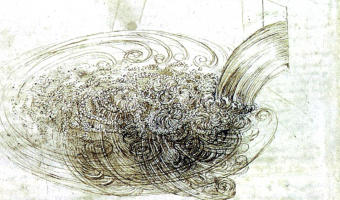
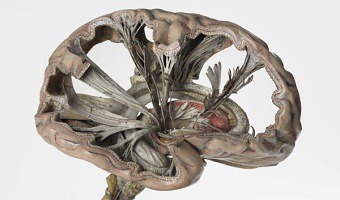
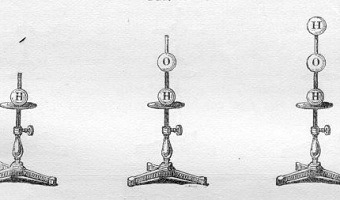
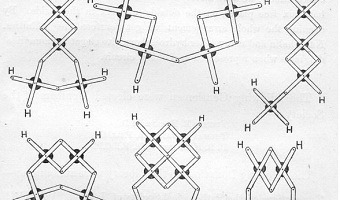
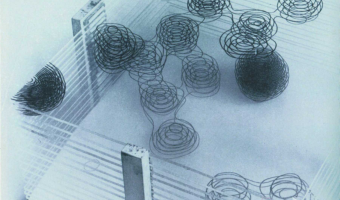
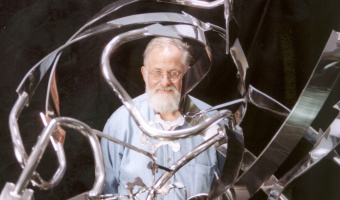
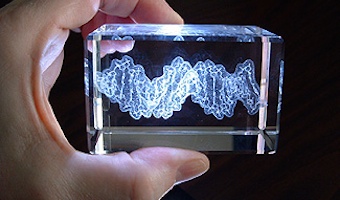
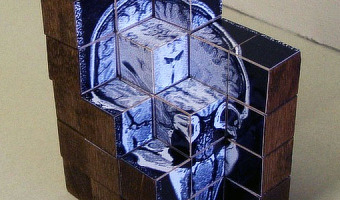
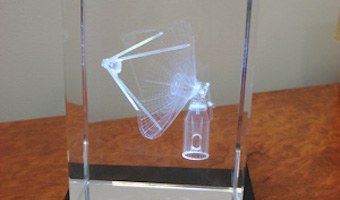
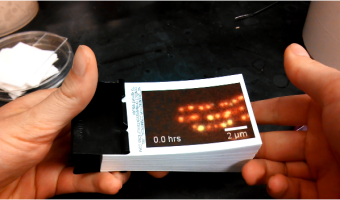
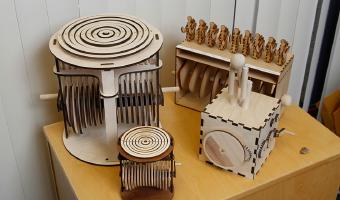
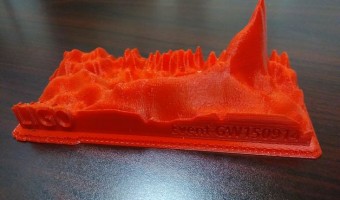
Tag: Science

1500 – Flow Visualization

Although today computer graphics is often used for doing flow visualization, a range of physical methods exist that can visualize flows in-place. Leonardo da Vinci was presumably one of the first to use these methods: Leonardo da Vinci (1452-1519) also developed techniques for observing the wind (by generating smoke in a tube and adding it to the wind at suitable points). Most important of all, he made actual experiments under controlled conditions. For this purpose, he used, among other […]

Added by: Pierre Dragicevic. Category: Measuring instrument  Tags: air, flow, science, smoke, water


1787 – Chladni Plates

In 1787, German physicist and musician Ernst Chladni published a technique to visualize the modes of vibration of a rigid surface. Chladni's technique [...] consisted of drawing a bow over a piece of metal whose surface was lightly covered with sand. The plate was bowed until it reached resonance, when the vibration causes the sand to move and concentrate along the nodal lines where the surface is still, outlining the nodal lines. The patterns formed by these lines are what are now called […]

Added by: Pierre Dragicevic. Category: Measuring instrument  Tags: acoustics, embedded, physics, science, sound


1866 – Kundt's Tube

Kundt's tube is an apparatus invented in 1866 by German physicist August Kundt for measuring the speed of sound. It mostly consists of a transparent tube of adjustable length with powder in it. Sound is produced at one end of the tube, and the tube's length is adjusted until the sound becomes louder, indicating the tube is at resonance and the sound forms a standing wave. The powder then accumulates at the nodes of the standing wave, where is no vibration. The wavelength of the sound can be […]

Added by: Pierre Dragicevic. Category: Measuring instrument  Tags: physics, science, sound


1880 – Winogradsky Columns

The Winogradsky column, invented by Sergei Winogradsky, consists in a transparent cylinder for analyzing microbial life by observing how the metabolism of micro-organisms evolve over time in stratified layers. By producing a small closed ecosystem, the column enables observing how bacteria can survive by providing a temporal and spatial visualization of layers such as in ecology, microbiology. Sources: The Microbiome of Your Gut Winogradsky Column—Microbial Evolution in a Bottle S. Kuznetsov, […]

Added by: Jean Vanderdonckt. Category: Uncertain  Tags: 3D, biology, cylinder, indexical, layers, science


1900 – Pearson and Lee's Height Correlation Chart

The physical model on the left is a bivariate histogram showing the correlation between the heights of fathers (horizontal axis) and sons ("vertical" axis). This data was famously collected by Karl Pearson and Alice Lee between 1893 and 1898. The physical visualization is thought to have been constructed around this time period or soon after, possibly under the supervision of Pearson. It is kept at the Department of Statistical Science, University College London, founded by Pearson in 1911. I […]

Added by: Pierre Dragicevic, sent by: Richard Chandler. Category: Passive physical visualization  Tags: correlation, distribution, science, statistics


1900 – Crum Brown's Mathematical Surface

Model by Alexander Crum Brown (1838-1922) of a half-twist mathematical surface, featuring a non-Euclidean so-called Klein bottle, c. 1900. Sources: Photo from the Science Museum, London, textual description courtesy of Klaus Hentschel. For more, see Klaus Hentschel (2014): Visual Cultures in Science, Technology and Medicine, pp. 96ff. and pl. XIV.

Added by: Pierre Dragicevic, sent by: Klaus Hentschel. Category: Physical model  Tags: mathematics, science


1905 – Rubens Tube

A Rubens tube, also known as a standing wave flame tube, or simply flame tube, is a physics apparatus for demonstrating acoustic standing waves in a tube. Invented by German physicist Heinrich Rubens in 1905, it graphically shows the relationship between sound waves and sound pressure, as a primitive oscilloscope. Today, it is used only occasionally, typically as a demonstration in physics education. The middle image shows materials scientist Anna Ploszajski blowing a trumpet into a Rubens […]

Added by: Pierre Dragicevic, sent by: Martin Hachet. Category: Measuring instrument  Tags: fire, standing waves, physics, science, sound


1960 – 3D Spectrogram

The object on the left may be one of the first sound sculptures. It appears in a 1960 book by German acoustician and musicologist Fritz Winckel (click on the middle image to see the full page). It is a physical 3D spectrogram showing a frequency analysis of an 8-second recording of Beethoven's Eighth Symphony. The left axis is frequency, the bottom/right axis is time, and the vertical axis is the strength of a particular frequency at a particular time. The figure caption uses the term […]

Added by: Pierre Dragicevic, sent by: Jill Hubley. Category: Passive physical visualization  Tags: music, science, sound, sound sculpture, spectrogram


1968 – Grace Hopper's Nanoseconds

Grace Hopper, a computer scientist and US Navy Rear Admiral, used wire to visualise very short durations of time in computing. Each wire is cut to the maximum distance that light or electricity can travel in a nanosecond, one billionth of a second. She wanted programmers to understand 'just what they're throwing away when they throw away a millisecond', and describes using them to help military commanders understand why signals take so long to relay via satellite. This lecture was given at MIT […]

Added by: Kim Plowright. Category: Passive physical visualization  Tags: wire, physics, science, single-datum, light


2017 – Gravity Wave Spectrogram - LIGO

Humanity has been gazing at light from distant stars since time immemorial. But in 2015, our ability to understand the University achieved a major milestone, when ripples in Spacetime itself - instead of light - told the tale of an ancient, cataclysmic collision between black holes. The Laser Interferometer Gravitational-Wave Observatory (LIGO) is an experimental system of almost unbelievable sensitivity. Using interferometer arms four kilometers long, it can detect changes in length as tiny as […]

Added by: Louis R. Nemzer. Category: Passive physical visualization  Tags: astronomy, Gravity Waves, physics, science