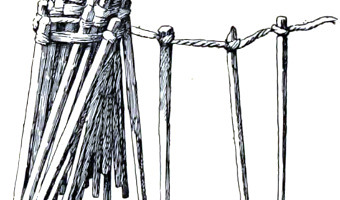
Tag: Self-Logging

1920 – Yakama Time Ball

Women from the Yakama Native American tribe used strings of hemp as personal diaries. Each major event in their life was represented by a knot, a bead or a shell. This mnemonic device is called an Ititamat, or counting-the-days ball, or simply time ball. The first image shows an Ititamat created before 1920. On the second image, each string is a different Ititamat. The last image shows a 2003 replica. A young woman would use a time ball to record her courtship, marriage, and other experiences […]

Added by: Pierre Dragicevic. Category: Passive physical visualization  Tags: anthropology, preliterate, self-logging, social use


1993 – Slumber: Brainwave Weaving

Slumber was a multi-year gallery installation/performance by artist Janine Antoni. From the website description: Performance with loom, yarn, bed, nightgown, EEG Machine and artist’s REM reading. Antoni transforms the fleeting act of dreaming into a sculptural process. Between 1994 and 2000, the artist slept in the bed while an electroencephalograph machine recorded her eye movement. During the day, Antoni would sit at the loom and weave shreds of her nightgown in the pattern of her REM. The […]

Added by: Judith Donath. Category: Passive physical visualization  Tags: brainwaves, dreams, EEG, fabric, self-logging, sleep, weaving


2008 – Psychogeographical Mapping: Travel Logging with LEGO bricks

American artist Cory Imig reconstructed the layout of the city of Savannah using LEGO bricks, and over the course of one month she added a colored brick every time she went to a particular place. Each color is a different day of the week. Source: Cory Imig (2008) Psychogeographical Mapping (see the section Documenting of her Web page for more data sculptures).

Added by: Pierre Dragicevic, sent by: Loren Madsen. Category: Passive physical visualization  Tags: data sculpture, LEGO, self-logging, temporal data, travels


2011 – Blip: A Year of Travel

In his experiments with visualizing data from Tripit to look back at his own (and other people's) travel, Cemre Güngör came up with a new system to create data sculptures from one's travels over time. This work is of a particular interest, in that it shows an excellent example of how a physical visualization design process unfolds, with many questions unique to physicalization add up to the challenge of designing an effective visual representation, i.e., contrasting materials and treatments […]

Added by: Fanny Chevalier. Category: Passive physical visualization  Tags: see-through, self-logging, temporal data, travel


2013 – Examined Life: Giving Shape to Activities

Designer Alex Getty logged his daily activities for 40 days and turned them into data sculptures that look like colored paper origami. Source: Alex Getty (2013) The Examined Life

Added by: Pierre Dragicevic. Category: Passive physical visualization  Tags: activity data, origami, paper, self-logging


2015 – Life in Clay: Sharing Memories through Data Pottery

Alice Thudt, a PhD student in Computational Media Design, crafts pieces of pottery that embody data about moments she shared with her loved ones. Left image (2015): cereal bowls showing Skype-call history between Alice and her parents. On the front bowl, each line represents a day where they skyped. On the other bowl, each dot represents 10 min of call time. She offered a bowl as a present to her parents and kept the other one as a reminder to stay in touch every time she has breakfast. Middle […]


2016 – Dataponics: Human-Vegetal Play

“Dataponics: Human-Vegetal Play” maps human physical activity measured by a Fitbit to the amount of light and water fed to a potted plant. Also, the system measures the moisture in the growing hydroponic medium (in this case, expanded clay) that surrounds the plant’s roots, and plays different internet radio stations accordingly. Source: Cercos, R., Nash, A., Yuille, J., Goddard, W. (2016) Coupling quantified bodies: affective possibilities of self-quantification beyond the self

Added by: Robert Cercos. Category: Active physical visualization  Tags: plants, self-logging


2017 – Wearable Self

Wearable Self is a collection of data jewelry which is Jiyeon Kang's master's thesis project at Parsons School of Design. South Korean designer Jiyeon Kang transformed a year of self-tracking data (e.g. daily steps) gathered by Fitbit and iPhone Health into personalized fashion items that can hold and wear. Through laser cut and 3d printing with different materials, the designer creates customizable fashion items generated by users' self-data, aiming to make self-tracking data more meaningful […]


2019 – Sleep Blanket

A visualization of my son's sleep pattern from birth to his first birthday. Crochet border surrounding a double knit body. Each row represents a single day. Each stitch represents 6 minutes of time spent awake or asleep. Source: Seung Lee (2019) Twitter thread. Related: Also see our entry 2013 – Temperature Scarves and Afghans.

Added by: Pierre Dragicevic, sent by: Steffen (@s1effen). Category: Passive physical visualization  Tags: baby, data clothing, fabric, self-logging, sleep


2024 – Travels on the Wind

Travels on the Wind is a tangible data visualization of a decade of travel. Each year is represented by a vertical thread with rings and beads encoding data about trip duration, region, season, transportation, accommodation, and companions. The piece was handcrafted over several months using 3D-printed elements, jewelry findings, and UV epoxy resin. Suspended from driftwood, it is both a personal story and a physical expression of data art. Sources: Project’s website Information is […]

Added by: Natalia Kiseleva. Category: Passive physical visualization  Tags: self-logging, personal data, 3D printing, travels, jewelry