Tag: Situated

2014 – District 5: Tube Charts Reveal Decline in Violence

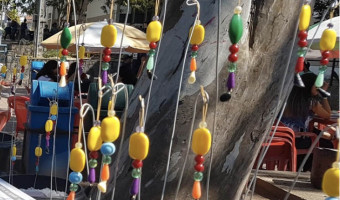
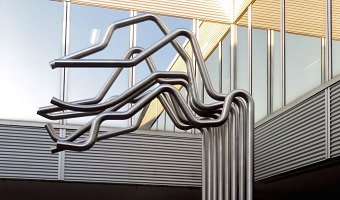
California-based artist Loren Madsen, a long-time data sculptor (see our 1995 entry and our interview with him), created an outdoor sculpture where steel tubes show falling crime rates across eight crime categories over 30 years. The sculpture stands in front of a police station and jail in Chicago City. Sources: ​Healther Schultz (2015) California Sculptor Completes Commissioned Piece. Image courtesy of Loren Madsen. Also see Steven Pinker's TED Talk on the topic.

Added by: Pierre Dragicevic, sent by: Loren Madsen. Category: Passive physical visualization  Tags: crime, data sculpture, statistics, temporal data, situated, urban, steel


2018 – Harassment Plants

Harassment Plants is a situated physicalization exhibited in a Brazilian city to represent stories of harassment experienced by women in a public lakeside. Each vase represents a different category of harassment and contains glyphs that represent cases of harassment. The color in the middle of the vase corresponds to the type of harassment, which is also represented by the same color in one of the beads. Each glyph is composed of a rod — whose length represents the time of the day the […]

Added by: Luiz Morais. Category: Passive physical visualization  Tags: glyph, hand-made, plants, sexual harassment, situated


2019 – Perpetual Plastic

Winner of the National Geographic and Sky Ocean Ventures Ocean Plastic Innovation Challenge [This project] highlights the scope of the plastic problem (in terms of amount produced as well as its fate) and the transformation of plastic over its lifetime, using beach debris as a salient example. The situated, participatory data installation approach extends abstract displays of numbers towards a more gripping form of ‘data visceralization.’ The direct link to beach clean-up activities suggests […]

Added by: Petra Isenberg. Category: Passive physical visualization  Tags: Environment, Situated, Pollution


2020 – Data Badges

   A physical conference badge that participants create themselves during an event by assembling tokens on a wearable canvas. The process is guided by an instruction sheet that helps translate the tokens to various professional characteristics. Sources: Tweet from Andre Vande Moere. Georgia Panagiotidou, Sinem Gorucu, Andrew Vande Moere (2020) Data Badges: Making an Academic Profile Through a DIY Wearable Physicalization. Related: Also see our entries on data jewellery and data […]

Added by: Georgia Panagiotidou. Category: Passive physical visualization  Tags: badge, situated


2023 – PlanetWalker: Public Physicalization of Walking Activity

PlanetWalker is a public physicalization displayed in an open workplace, using a mosaic art style to present the walking activity of 16 co-located users over four weeks. The mosaic patterns were pre-designed based on the eight planets (Mercury, Venus, Earth, Mars, Jupiter, Saturn, Uranus, and Neptune), symbolizing exploration and representing individual users. It encouraged participants to walk 7,500 steps per day. This daily goal was divided into ten small goals, each represented by a colored […]


2024 – Bike Repair Stations as 3D Sculptures

Making the Invisible Visible is a project that tracks cyclists’ routes throughout the city and transforms this data into three-dimensional sculptures that double as public bike repair stations. These sculptural objects not only enhance public space and act as reference points for urban navigation, but also invite cyclists to reflect on bicycle movement across Quito (Ecuador) while repairing their bikes. Sources: Barriga-Abril, X., Vivanco, J., Rosas, C., Medina, X., Aulestia, A., & […]

Added by: Xavier Barriga-Abril. Category: Passive physical visualization  Tags: cartographics, bicycle, urban, situated, city, data sculpture, steel