Between 1839 and 1853 the French mathematician Théodore Olivier created string models to teach and demonstrate descriptive geometry, some of which could be manipulated. He was a student of French mathematician Gaspard Monge, who invented descriptive geometry and was already illustrating his ideas with rudimentary string models. Photo above: intersection of two cylinders. Sources: Nicholas Mee (2013) Strings, Surfaces and Physics. Photo above taken in the Musée des Arts et Métiers in Paris, see […]
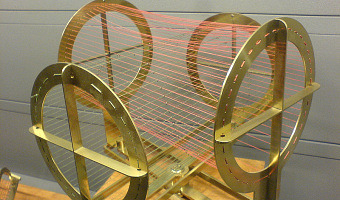
Between 1839 and 1853 the French mathematician Théodore Olivier created string models to teach and demonstrate descriptive geometry, some of which could be manipulated. He was a student of French mathematician Gaspard Monge, who invented descriptive geometry and was already illustrating his ideas with rudimentary string models. Photo above: intersection of two cylinders. Sources: Nicholas Mee (2013) Strings, Surfaces and Physics. Photo above taken in the Musée des Arts et Métiers in Paris, see flickr set. Other models at exposed at the Canada Science and Technology Museum (but not in such a good shape!), see flickr set.
Added by: Pierre Dragicevic.
Category:
Physical model
Tags:
geometry, mathematics, mechanical interaction, teaching