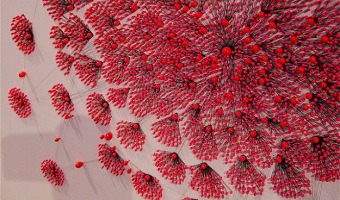
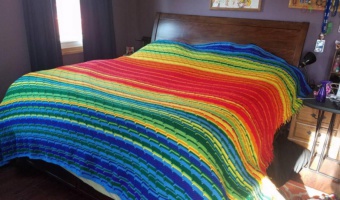
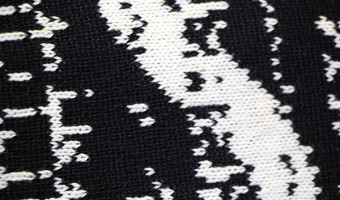
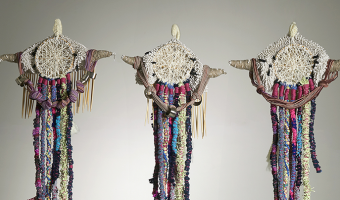
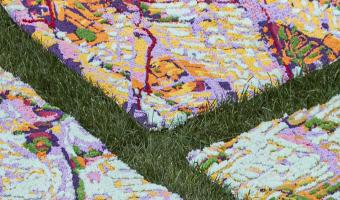
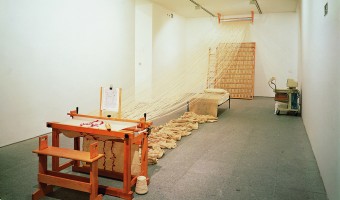
Tag: Textile

2011 – Digital Arab Spring

Twitter-networks were used by the citizens of the North African states to communicate and organize during the Arab Spring. The virtuality of a computer network becomes tactile and palpable here, like the virtual organization led to actual protests in the streets. The purpose of this data visualisation is to illustrate a magazine-cover and spread and was created as part of an academic graphic design programme. Sources: René Rieger, Digital Arab Spring. Gestalten Blackboard entry (2012).

Added by: René Rieger. Category: Passive physical visualization  Tags: citizen infrastructures, network, textile, twitter


2015 – Climate Datascapes

Artist Tali Weinberg is working since 2015 on extensive series of textile data-art documenting heat waves, water color variations, average temperatures, etc. On her website you can discover the dozen different pieces from the “Climate Datascape” series, as well as other data projects. I translate climate data from the National Oceanic and Atmospheric Administration into abstracted landscapes and waterscapes, materializing the data with plant-derived fibers and dyes and […]

Added by: Anne-Laure Fréant. Category: Passive physical visualization  Tags: textile, weaving, climate, environment, hand-made


2016 – Accomplishments

Accomplishments is an exploration of personal data tracking, wearable art, wearable technology, social media, and data physicalization. Each day accomplishments were tracked, first on paper then by sewing spheroid masses onto a dress worn for four months. By hand sewing each accomplishment onto this dress, they became a part of the wearer's physical presence and identity. The work juxtaposes the immediateness of social media posts, and the separate identity we create for ourselves online which […]

Added by: Michelle Sylvestre. Category: Passive physical visualization  Tags: data clothing, textile


2018 – Stretch Orchestra Marble Run

A connected exercise pad made with textile sensors responds to your interaction by inviting you to experience physical activity data in a playful way; a giant marble run, to elicit a childlike feeling of wonder and satisfaction. The installation is part of research project using materials to explore the experience of systems and technologies designed to aid behaviour change. In collaboration with intelligent textiles innovators Footfalls and Heartbeats the interactive installation proposes a […]

Added by: Marion Lean. Category: Interactive installation  Tags: exercise, marble, textile


2019 – The 100-Year Climate Yarn

The 100 Year Climate Yarn is a large, crocheted Data-Art wall-hanging which tracks the daily maximum temperatures in Adelaide, South Australia over a 100 year period from 1920 to 2020. Textile Artist Sandra Lepore worked with Energy & Climate Specialist Heather Smith to plan the work using colours carefully selected to emphasise extreme temperatures. Sources: www.facebook.com/myclimateyarn/ www.instagram.com/myclimateyarn/ Related: Also see our entry 2013 – Temperature Scarves and Afghans […]

Added by: Sandra Lepore. Category: Passive physical visualization  Tags: data clothing, temperatures, textile, weather


2019 – Sleep Blanket

A visualization of my son's sleep pattern from birth to his first birthday. Crochet border surrounding a double knit body. Each row represents a single day. Each stitch represents 6 minutes of time spent awake or asleep. Source: Seung Lee (2019) Twitter thread. Related: Also see our entry 2013 – Temperature Scarves and Afghans.

Added by: Pierre Dragicevic, sent by: Steffen (@s1effen). Category: Passive physical visualization  Tags: baby, data clothing, textile, self-logging, sleep


2021 – Soft City

Soft City is a large-scale textile series that maps the urban fabric of Black neighborhoods in the Boston area. The tapestries map historic (redlined) and contemporary Black neighborhoods, including Roxbury, Dorchester, and East Cambridge. The information mapped tells the story of the past, present and future of Black residents, and the ecological resilience of the neighborhoods they live in. Hard (impervious) and soft (pervious) land uses are codified using colors with overlays of Black […]

Added by: Anne-Laure Freant. Category: Passive physical visualization  Tags: textile, cartographic, city, tufting


2022 – Jordan Cunliffe's Data Embroidery

Jordan Cunliffe is an embroidery designer and author with a focus on data and storytelling. Cunliffe is taking traditional and historic textile techniques, and pairing them with contemporary concepts. Her work includes binary encoding of her childhood diary with black and white beads, representing overlapping series of data using embroidery, representing time, sleep patterns, migration patterns, with threads and beads. Jordan Cunliffe is the author of a book called “Record, Map & […]

Added by: Anne-Laure Freant. Category: Passive physical visualization  Tags: textile, beads


2024 – Sensing Data

The Sensing Data course was held at KH-Berlin weißensee in 2024–2025. Its focus was on questioning “What happens when we can not only read information visually, but also can experience it through other senses?”. As a result of the course, 17 student projects have been realized, all being original data-physicalizations involving textile work addressing a specific research question. All 17 projects are documented on the course’s website. Source: Mark-Jan Bludau (2025) Sensing […]

Added by: Anne-Laure Fréant. Category: Passive physical visualization  Tags: textile, course, teaching, education


2025 – Mississippi Braille Map

Anne Lacambre is the atlas editor of the French publisher Autrement, and also an embroidery artist. Among many other projects around the embroidering of maps, Anne reproduced an ancient Braille map of the Mississippi entirely with white thread on a white fabric, to reproduce the white on white look of the original Braille map. Relief has been rendered with specific stitches, to represent both the shape of the river and the dots representing the cities names in Braille. This map offers a tactile […]

Added by: Anne-Laure Freant. Category: Passive physical visualization  Tags: textile, braille, cartographic