Adrien Segal is an artist with a background in furniture design. She takes a data-driven approach where she uses data of natural events and environmental developments and transforms them into beautiful furniture. The choice of forms and materials conveys the origin of the data in an intriguing way.
Left image:
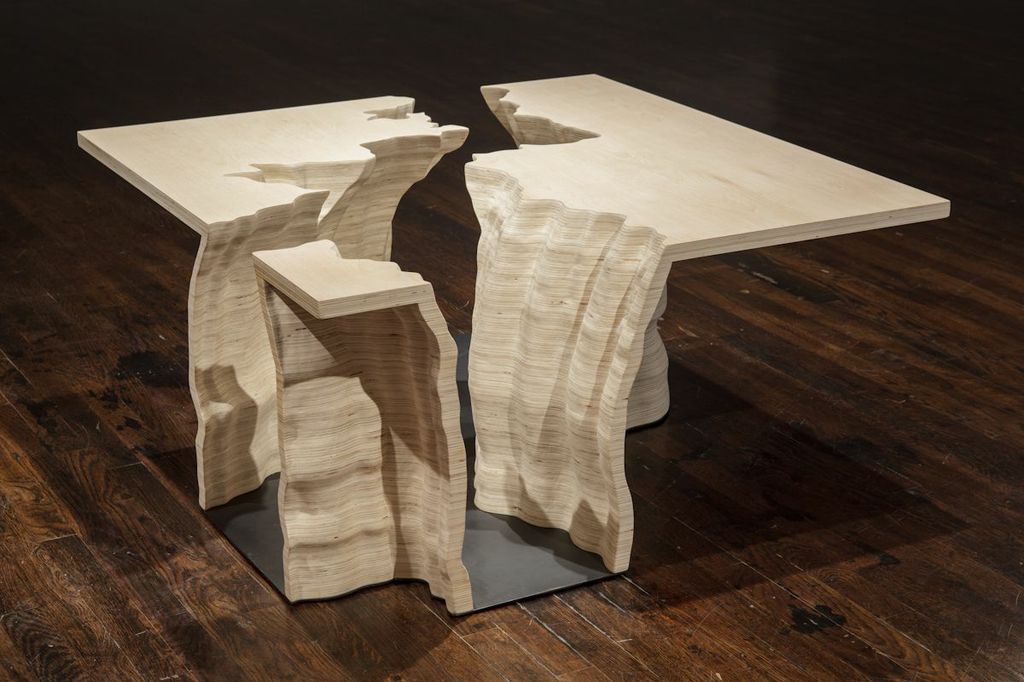
TRENDS IN WATER USE is a data sculpture that graphs national statistics of water usage in the United States over 50 years, from 1950 - 2000. The width of the canyon walls represent how much water is used. Each river or tributary represents a specific category of water use based on the USGS report; Thermoelectric Power, Irrigation, Industrial, Public Supply, Domestic, and Mining/Aquaculture/Livestock/Rural (combined). The shape of the canyon as seen from above is derived from a map of the Colorado River in its entirety (Thermoelectric) and it’s main tributary, the Green River (Irrigation), as well as three smaller tributaries - accounting for all water (fresh and saline) withdrawn in the United States each day: 408,000 million gallons.
Right image:
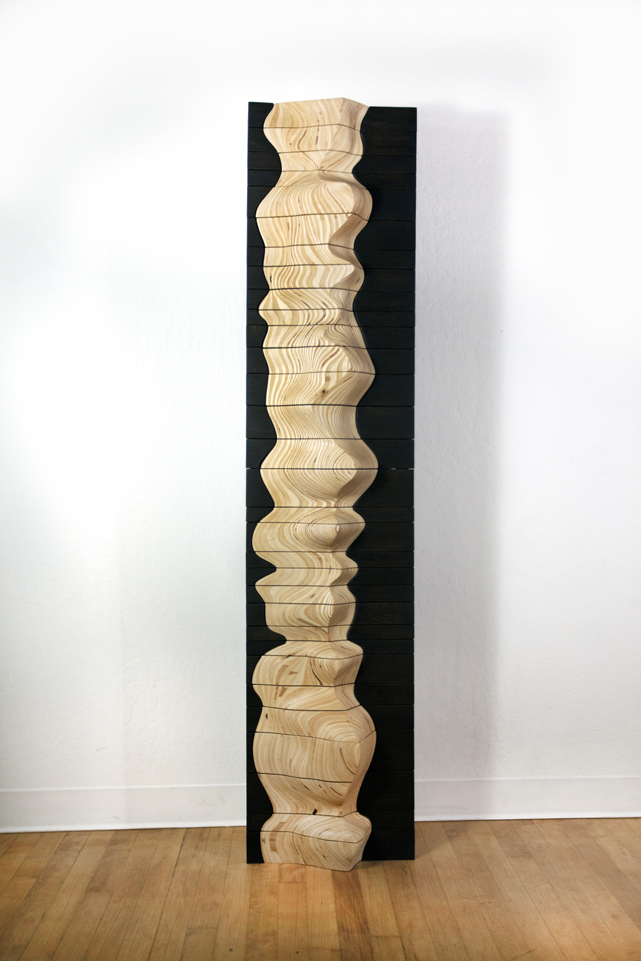
SNOW WATER EQUIVALENT CABINET is a data sculpture illustrating snowpack measurements recorded at Ebbetts Pass in the Sierra Nevadas of California. Sourcing SNOTEL data archived on the National Water and Climate Center's website, 31 total water years of data are represented, from 1980 - 2010. The height of each drawer layer is relative to the annual total precipitation by year. The sculpted plywood front is a three dimensional graph of the amount of water in the snow-pack at any given time during the water year, showing specifically the first snowfall, peak amount of water, and final snowmelt as changes occur from year to year. The size of each drawer is directly related to the amount of water in the snowpack, the smaller the drawer the less water stored, and the less storage space available in the drawer.
Check out the artist's website linked under sources for details of the data mappings used and the construction process.
Sources:
- Adrien Segal. Project page for Trends in Water Use (2011).
- Adrien Segal. Instructable for Trends in Water Use.
- Adrien Segal. Project page for Snow Water Equivalent Cabinet (2011).