
Although today computer graphics is often used for doing flow visualization, a range of physical methods exist that can visualize flows in-place. Leonardo da Vinci was presumably one of the first to use these methods:
Leonardo da Vinci (1452-1519) also developed techniques for observing the wind (by generating smoke in a tube and adding it to the wind at suitable points). Most important of all, he made actual experiments under controlled conditions. For this purpose, he used, among other things, a tank containing water mixed with fine millet, through which he moved solids, observing the flow past them. Leonardo wrote: “The movement of water within water proceeds like that of air within air.“
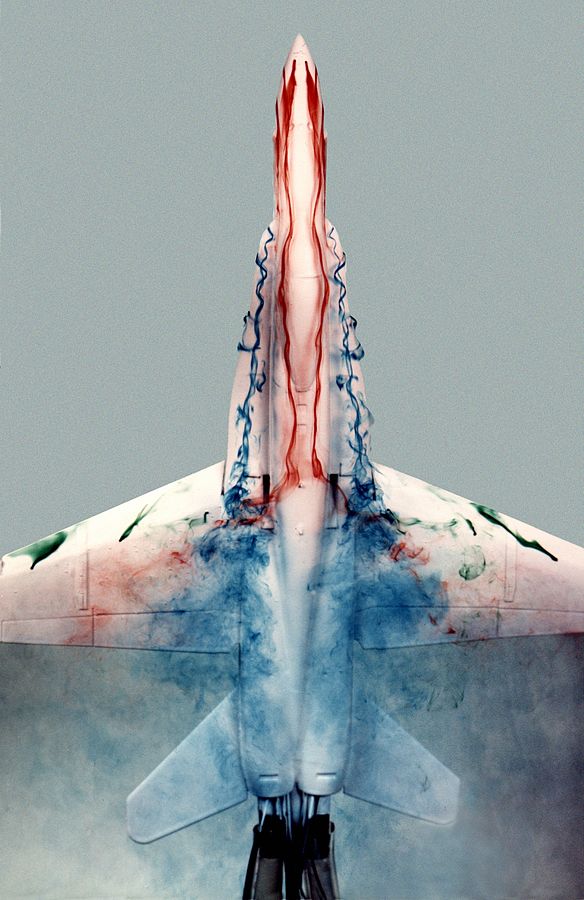
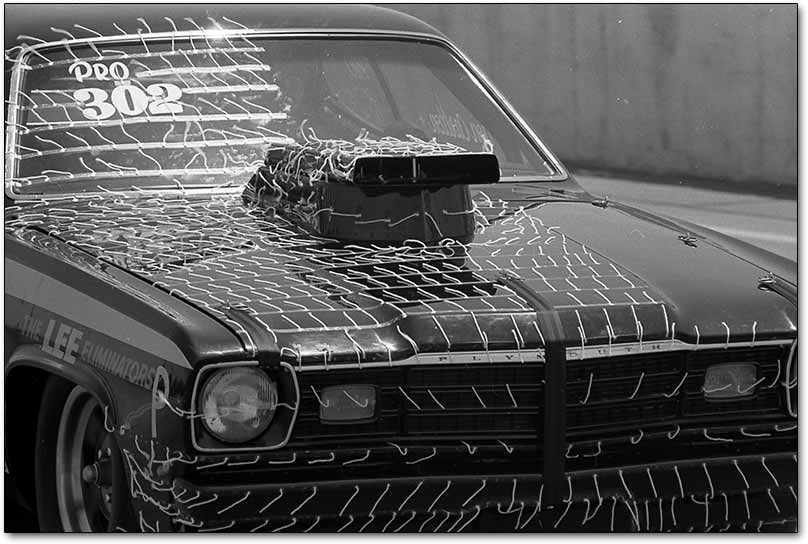
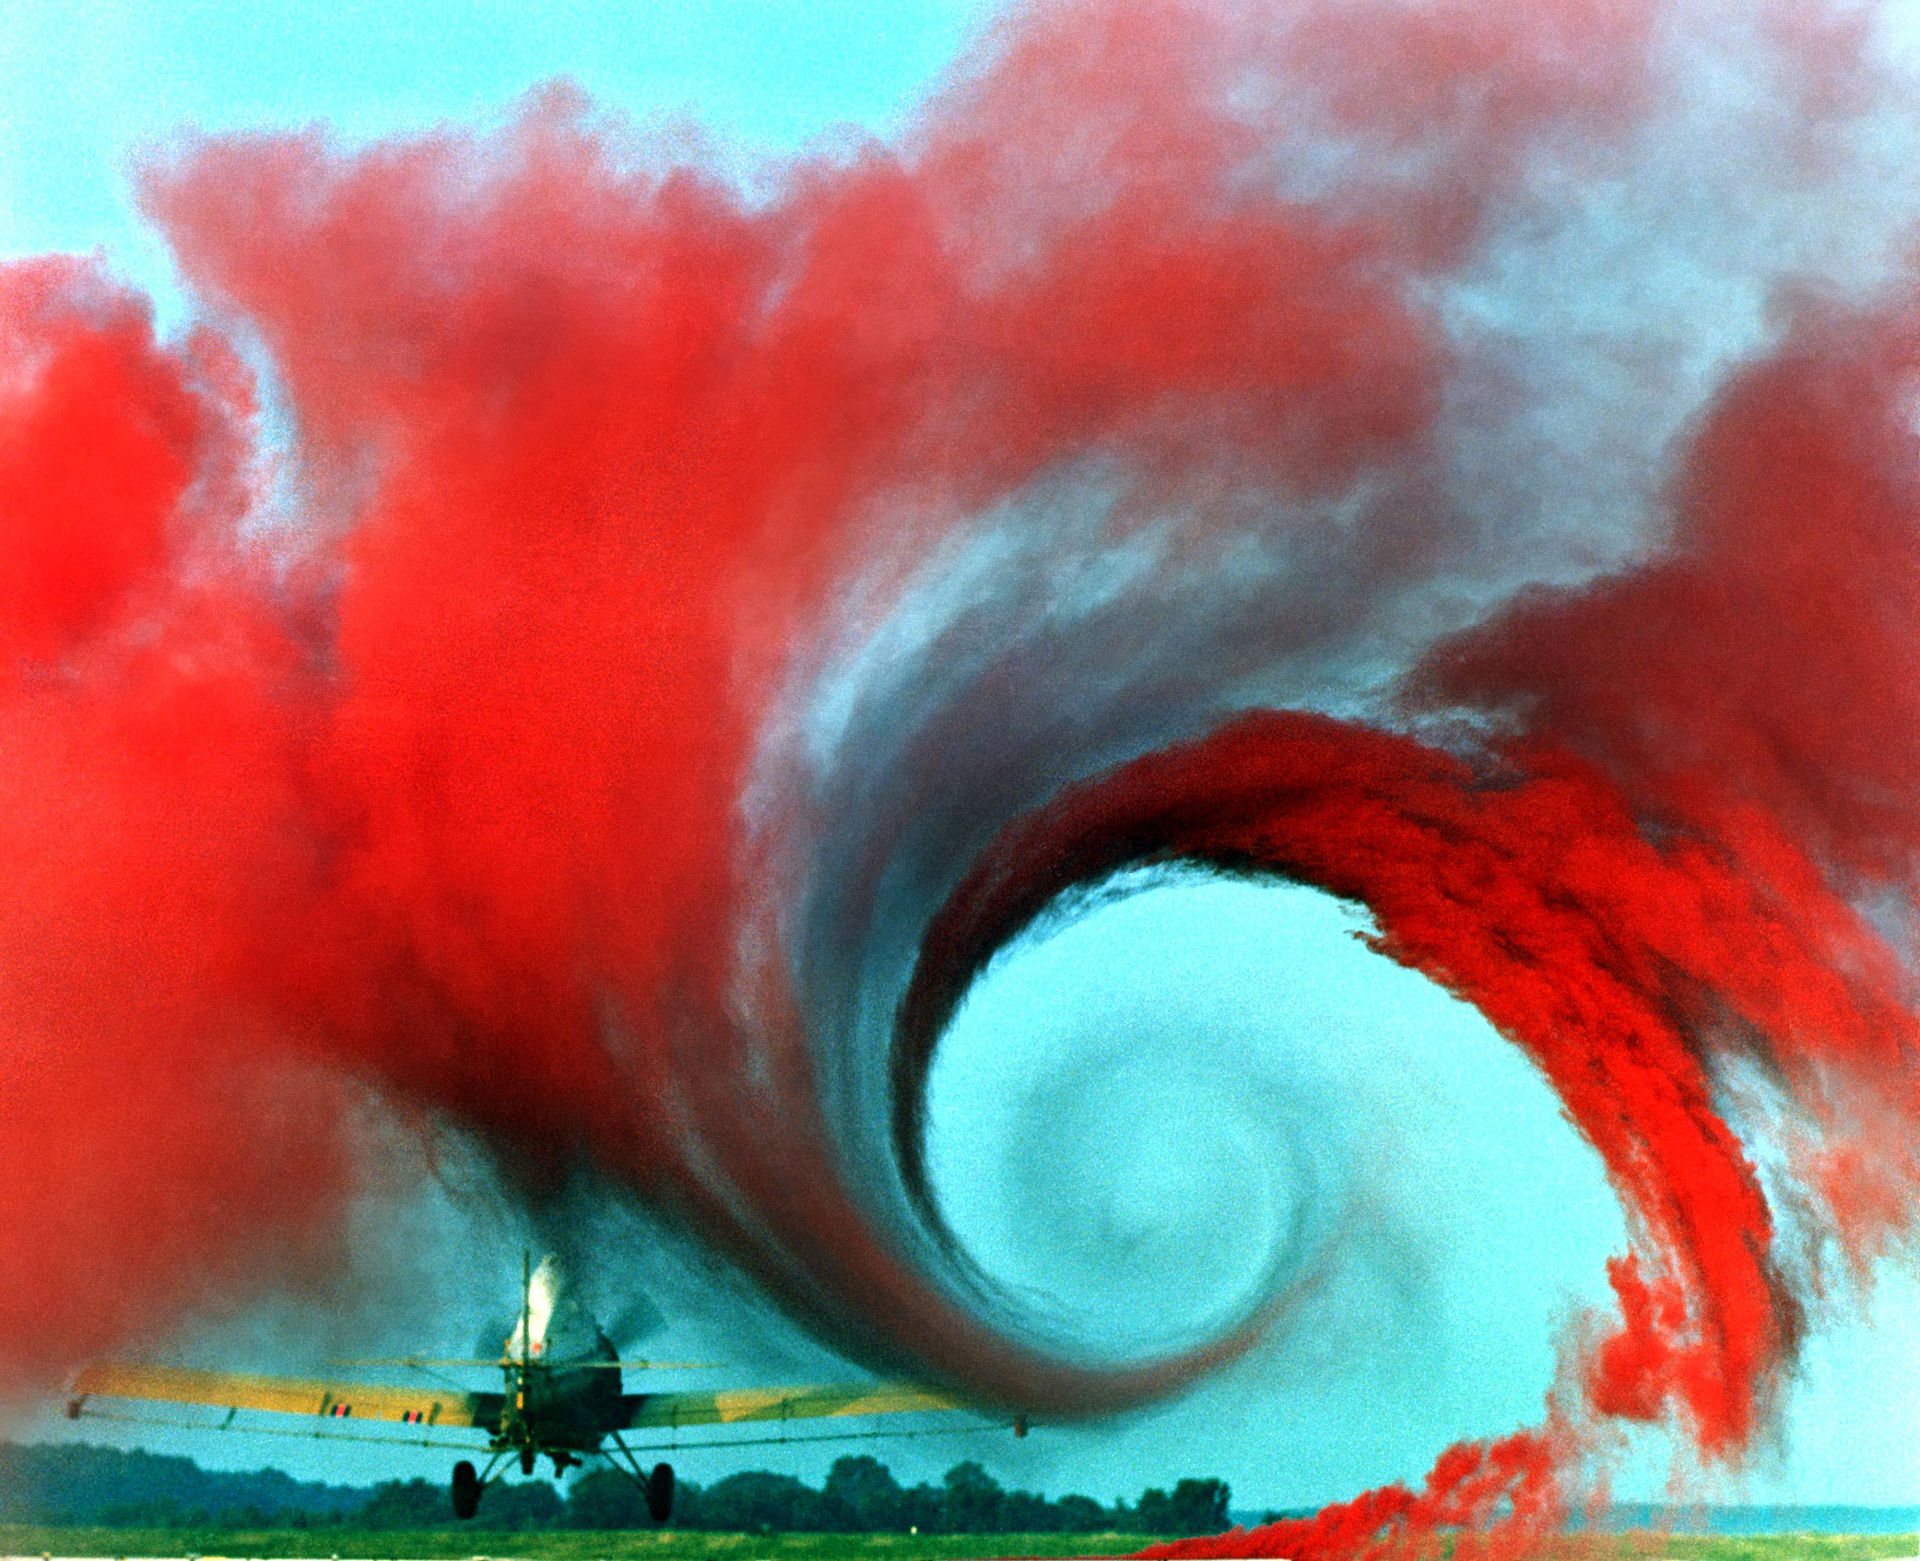
The left image shows a drawing from Leonardo da Vinci. The remaining images show more modern methods involving the use of die, cotton tufts, and colored smoke.
Sources:
- Peter Freymuth (1993) Flow visualization in fluid mechanics. Review of scientific instruments.
- William E. Boeing Department of Aeronautics and Astronautics (2016) Flow Visualization.
- Pat Hanrahan (2004) Self-Illustrating Phenomena.
- Willett et al. (2016) Embedded Data Representations.
- Images from (left to right) Uppsala Universitet, Dryden Flight Research Center NASA, Joe Pappas and Dick Oldfield, and NASA Langley Research Center.
.jpg#/media/File:FA-18_model_water_tunnel_visualisation_DFRC_763x1280.jpg)