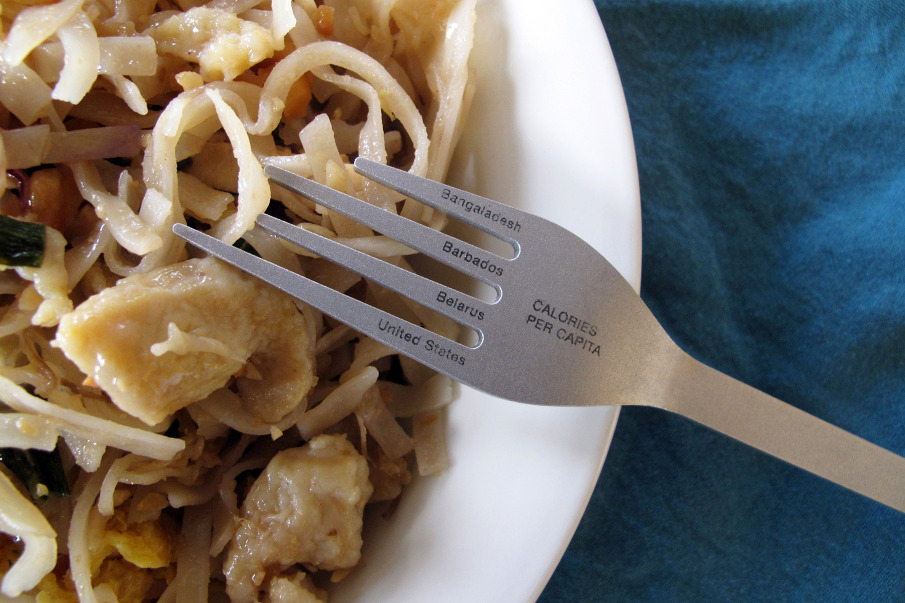
Another data-driven tableware, this time conveying world statistics. The fork on the image shows calories consumption for the US and three other countries.
Source: Nadeem Haidary.
Added by: Yvonne Jansen, sent by: Fanny Chevalier.
Category:
Passive physical visualization
Tags:
data sculpture, tableware, world statistics